eG Agents Test
To receive precise, real-time updates on the performance and overall health of the components being monitored, administrators need to ensure that the eG agents, which perform the actual monitoring functions, are installed in the environment and are running at all times. This test periodically monitors the status of agents to report whether they are installed or not, and if installed, whether/not they are running. Also, this test helps administrators identify the agents that are not installed/running but are assigned to monitor the components using User/VM-based eG Monitoring License.
Target of the test : The eG Manager
Agent deploying the test : An internal/remote agent
Outputs of the test : One set of results for the eG manager being monitored.
| Parameter | Description |
|---|---|
|
Test period |
How often should the test be executed . |
|
Host |
The host for which the test is to be configured. |
|
Port |
The port number at which the specified host listens. |
|
Exclude Agents |
If you wish to exclude one/more eG agents that are currently not running/installed from the scope of monitoring, then, you can specify a comma-separated list of agents against this text box. By default, this parameter is set to none. |
|
JMX Remote Port |
Here, specify the port at which the JMX listens for requests from remote hosts. In the <EG_MANAGER_INSTALL_DIR>\manager directory (on Windows; on Unix, this will be the /opt/egurkha/manager directory) of the eG manager, you will find a management.properties file. Set the port defined against the com.sun.management.jmxremote.port parameter of the file as the JMX Remote Port. |
|
JMX User, Password, and Confirm Password |
By default, JMX requires no authentication or security. Therefore, the User, Password , and Confirm Password parameters are set to none by default. |
|
JNDIName |
The JNDIName is a lookup name for connecting to the JMX connector. By default, this is jmxrmi. If you have registered the JMX connector in the RMI registry using a different lookup name, then you can change this default value to reflect the same. |
|
JMX Provider |
This test uses a JMX Provider to access the MBean attributes of the eG manager and collect metrics. Specify the package name of this JMX Provider here. By default, this is set to com.sun.jmx.remote.protocol. |
|
Timeout |
Specify the duration (in seconds) for which this test should wait for a response from the eG manager. If there is no response from the eG manager beyond the configured duration, the test will timeout. By default, this is set to 240 seconds. |
|
DD Frequency |
Refers to the frequency with which detailed diagnosis measures are to be generated for this test. The default is 1:1. This indicates that, by default, detailed measures will be generated every time this test runs, and also every time the test detects a problem. You can modify this frequency, if you so desire. Also, if you intend to disable the detailed diagnosis capability for this test, you can do so by specifying none against DD frequency. |
|
Detailed Diagnosis |
To make diagnosis more efficient and accurate, the eG Enterprise embeds an optional detailed diagnostic capability. With this capability, the eG agents can be configured to run detailed, more elaborate tests as and when specific problems are detected. To enable the detailed diagnosis capability of this test for a particular server, choose the On option. To disable the capability, click on the Off option. The option to selectively enable/disable the detailed diagnosis capability will be available only if the following conditions are fulfilled:
|
| Measurement | Description | Measurement Unit | Interpretation |
|---|---|---|---|
|
Licensed agents |
Indicates the total number of agents configured in the eG manager. |
Number |
|
|
Not running licensed agents |
Indicates the number of agents (configured in the eG manager) that are not running currently.
|
Number |
An agent that is not running will not be able to collect metrics from the components assigned to it for monitoring. Without metrics, the eG manager will have no basis for determining the state of the related components, and will hence be forced to attach an Unknown state to all components monitored by that agent. Use the detailed diagnosis of this measure to identify the agents that are not currently running. |
|
Not installed licensed agents |
Indicates the number of agents (configured in the eG manager) that have not been installed. |
Number |
While actively using the eG Enterprise, you may come across situations where an agent is configured in the eG manager for monitoring one/more components, but the agent software is not physically deployed on a host. The value of this measure is indicative of how many such configured but not installed agents are available in the environment. Such agents again will not be able to extract performance statistics from components. These components will hence assume the Unknown state, until the agent is physically deployed and started. Use the detailed diagnosis of this measure to know which agents are yet to be installed. |
|
Agents for components with user/desktop licenses |
Indicates the number of agents assigned to components that are monitored with User/VM-based eG Monitoring License. |
Number |
This measure is applicable only in environments where the license of the eG manager permits monitoring components using User/VM-based eG Monitoring License. |
|
Not running agents for components with user/desktop licenses |
Indicates the number of agents that are currently not running while they are assigned to the components that are monitored with User/VM-based eG Monitoring License. |
Number |
This measure is applicable only in environments where the license of the eG manager permits monitoring components using User/VM-based eG Monitoring License. Use the detailed diagnosis of this measure to identify the agents that are not running but are assigned to monitor the components that are monitored with User/VM-based eG Monitoring License. |
|
Not installed agents for components with user/desktop licenses |
Indicates the number of agents that have not been installed to monitor the components that are monitored with User/VM-based eG Monitoring License. |
Number |
This measure is applicable only in environments where the license of the eG manager permits monitoring components using User/VM-based eG Monitoring License. Use the detailed diagnosis of this measure to identify the agents that have not been installed to monitor the components that are monitored with User/VM-based eG Monitoring License. |
|
Percentage of agents not installed |
Indicates the percentage of agents that have not been installed. |
Percentage |
|
|
Agents reporting to this manager |
Indicates the total number of eG agents reporting to the eG manager. |
Number |
The value of this measure is the sum of Licensed agents and Agents for components with user/desktop licenses measures. |
|
Percentage of agents not running |
Indicates the percentage of agents that are not running currently. |
Percentage |
|
|
New not running agents in the last measure period |
Indicates the number of agents that were not running since the last measurement period. |
Number |
Use the detailed diagnosis of this measure to identify the agents that are not running since the last measurement period. |
|
Not running agents |
Indicates the total number of agents that are not running currently. |
Number |
The value of this measure is the sum of Not running licensed agents and the Not running agents for components with user/desktop licenses measures. |
|
Not installed agents |
Indicates the total number of agents that have not been installed. |
Number |
The value of this measure is the sum of Not installed licensed agents and the Not installed agents for components with user/desktop licenses measures. |
The detailed diagnosis of the Not running licensed agents measure lists the IP address/nick name of the eG agents that are configured in the eG manager but are not running currently.
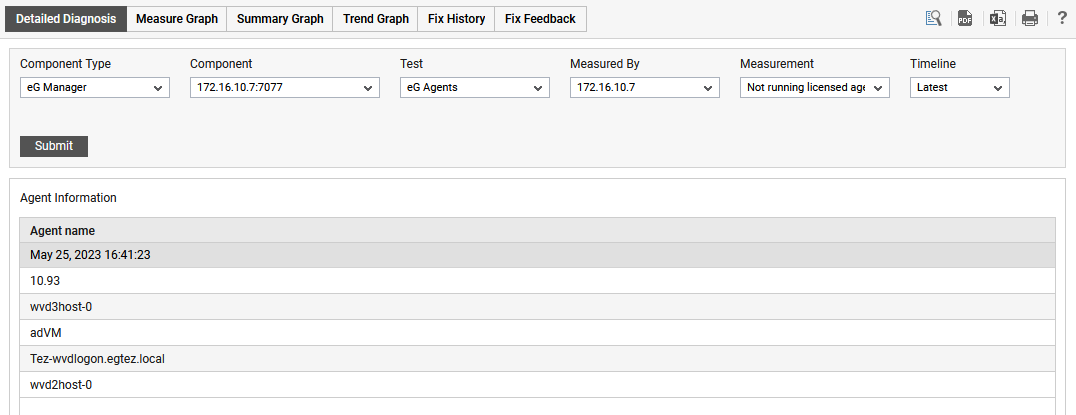
Figure 6 : The detailed diagnosis of the Not running licensed agents measure
The detailed diagnosis of the Not installed licensed agents measure lists the IP address/nick name of the eG agents that are configured in the eG manager but are not installed currently.
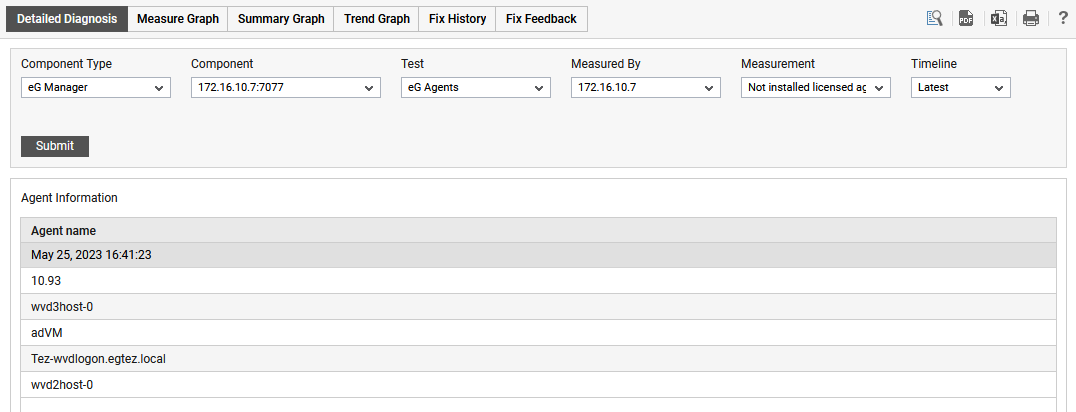
Figure 7 : The detailed diagnosis of the Not installed licensed agents measure
The detailed diagnosis of the Not running agents for components with user/desktop licenses measure lists the IP address/nick name of the eG agents that are currently not running while they are assigned to the components that are monitored with User/VM-based eG Monitoring License.
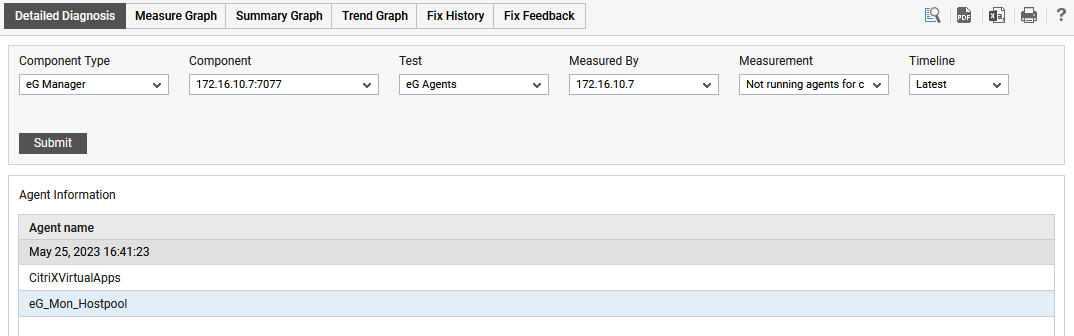
Figure 8 : The detailed diagnosis of the Not running agents for components with user/desktop licenses measure
The detailed diagnosis of the Not installed agents for components with user/desktop licenses measure lists the IP address/nick name of the eG agents that have not been installed while they are assigned to the components that are monitored with User/VM-based eG Monitoring License.
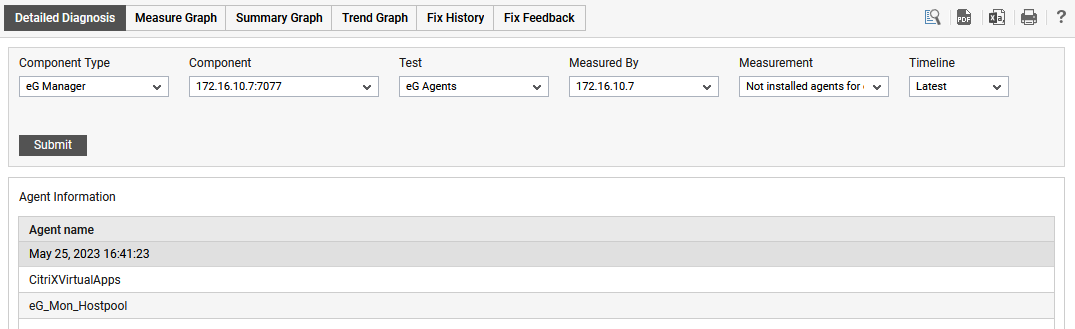
Figure 9 : The detailed diagnosis of the Not installed agents for components with user/desktop licenses measure
The detailed diagnosis of the New not running agents in the last measure period measure lists the IP address/nick name of the eG agents that were not running since the last measurement period.
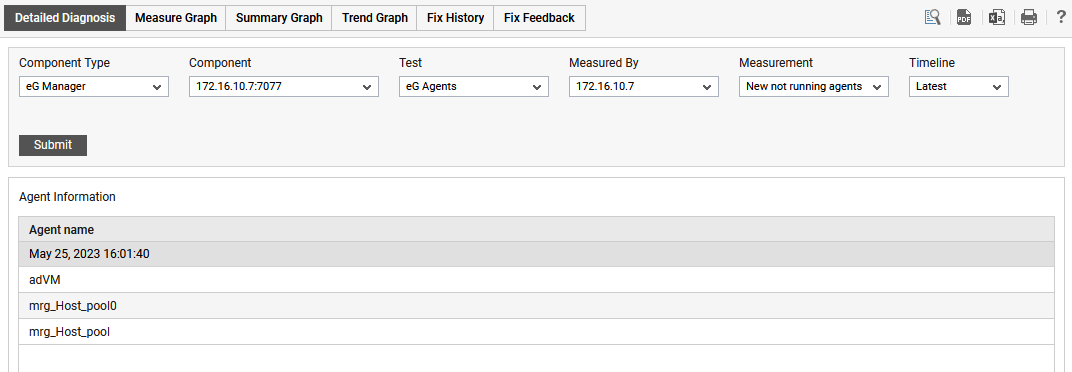
Figure 10 : The detailed diagnosis of the New not running agents in the last measure period measure