eG Database Cleanup Test
To conserve space in the eG backend, administrators can schedule the automatic cleanup of tables from the eG database at specified intervals. If the cleanup process does not function as per schedule, the database may grow in size, thereby choking manager operations. You can avoid this by using this test to periodically check on the status of the cleanup activity, quickly detect cleanup failures, and also zero-in on the exact tables for which the activity failed, so that remedial measures can be swiftly initiated.
Target of the test : The eG Manager
Agent deploying the test : An internal/remote agent
Outputs of the test : One set of results for the eG manager being monitored
| Parameter | Description |
|---|---|
|
Test period |
How often should the test be executed . |
|
Host |
The host for which the test is to be configured. |
|
Port |
The port number at which the specified host listens. |
|
JMX Remote Port |
Here, specify the port at which the JMX listens for requests from remote hosts. In the <EG_MANAGER_INSTALL_DIR>\manager directory (on Windows; on Unix, this will be the /opt/egurkha/manager directory) of the eG manager, you will find a management.properties file. Set the port defined against the com.sun.management.jmxremote.port parameter of the file as the JMX Remote Port. |
|
User, Password, and Confirm Password |
By default, JMX requires no authentication or security. Therefore, the User, Password , and Confirm Password parameters are set to none by default. |
|
JNDIName |
The JNDIName is a lookup name for connecting to the JMX connector. By default, this is jmxrmi. If you have registered the JMX connector in the RMI registry using a different lookup name, then you can change this default value to reflect the same. |
|
JMX Provider |
This test uses a JMX Provider to access the MBean attributes of the eG manager and collect metrics. Specify the package name of this JMX Provider here. By default, this is set to com.sun.jmx.remote.protocol. |
|
Timeout |
Specify the duration (in seconds) for which this test should wait for a response from the eG manager. If there is no response from the eG manager beyond the configured duration, the test will timeout. By default, this is set to 240 seconds. |
|
Detailed Diagnosis |
To make diagnosis more efficient and accurate, the eG Enterprise embeds an optional detailed diagnostic capability. With this capability, the eG agents can be configured to run detailed, more elaborate tests as and when specific problems are detected. To enable the detailed diagnosis capability of this test for a particular server, choose the On option. To disable the capability, click on the Off option. The option to selectively enable/disable the detailed diagnosis capability will be available only if the following conditions are fulfilled:
|
| Measurement | Description | Measurement Unit | Interpretation | ||||||||
|---|---|---|---|---|---|---|---|---|---|---|---|
|
Cleanup status |
Indicates the current status of the database cleanup activity. |
|
The values that this measure reports and the numeric values that correspond to them have been discussed in the table below:
Note: By default, this measure reports the Measure Values listed in the table above to indicate the current database cleanup status. The graph of this measure however, represents the same using the numeric equivalents only. |
||||||||
|
Time taken for cleanup |
Indicates the total time taken for the entire cleanup process.
|
Minutes |
Ideally, the value of this measure should be low. A steady rise in this measure value is a cause for concern, as it indicates that the eG manager is taking an unusually long time to cleanup the database. This could be because of the presence of a large volume of data to be cleaned up. You may hence want to consider tuning the cleanup frequency, so that the database always has less data to cleanup. |
||||||||
|
Total successfully cleaned tables |
Indicates the number of tables that were successfully cleaned up. |
Number |
Use the detailed diagnosis of this measure to know which tables were successfully cleaned. |
||||||||
|
Time since recent cleanup |
Indicates the elapsed time since the last cleanup. |
Minutes |
With the help of this measure, you can quickly detect whether a scheduled cleanup occurred on the eG database or not. |
||||||||
|
Has cleanup run today? |
Indicates whether cleanup has run this day or not. |
|
Typically, cleanup is scheduled to take place at the end of every day. If the value of this measure is Yes, it indicates that cleanup has run today. On the other hand, if this measure reports the value No, it indicates that cleanup is yet to run for that day or has not run at all. The numeric values that correspond to the current day's cleanup status are as follows:
Note: By default, this measure reports the Measure Values listed in the table above to indicate whether/not cleanup has run today. The graph of this measure however, represents the same using the numeric equivalents only. |
||||||||
|
Is cleanup running as a separate process? |
Indicates whether/not cleanup is running as a separate process.
|
|
The eG manager runs as a Java process. The maximum heap memory that can be allocated to a 32-bit eG manager process is limited to 1.5 GB. The maximum heap memory allocation to a 64-bit eG manager process on the other hand, is limited to 3 GB. Even if the physical server on which the eG manager is installed has more memory, since it is a single Java process, the eG manager cannot exploit the additional memory available on the server. To overcome this limitation, in eG Enterprise, the critical eG manager functions such as email alert management, threshold computation, trending, and database cleanup activities can all be run as separate Java processes (i.e., in addition to the core eG manager process). Removing these key functions from the core eG manager process makes additional memory available for the core eG manager functions including data reception and analysis, alarm correlation, and web-based access and reporting. This reconfiguration of the eG manager into separate Java processes allows the eG manager to make better utilization of available server hardware resources and thereby offers enhanced scalability. In turn, this allows customers to get more leverage from their existing investment in the hardware that hosts the eG manager. If cleanup has been configured to run as a separate Java process, then the value of this measure will be Yes. If not, then this measure reports the value No. The numeric values that correspond to the measure values above are as follows:
Note: By default, this measure reports the Measure Values listed in the table above to indicate whether/not cleanup runs as a separate Java process. The graph of this measure however, represents the same using the numeric equivalents only. |
||||||||
|
Has cleanup timed out? |
Indicates whether/not the last database cleanup process timed out. |
|
If the last cleanup process timed out, then the value of this measure will be Yes. If not, then this measure reports the value No. The numeric values that correspond to the measure values above are as follows:
Note: By default, this measure reports the Measure Values listed in the table above to indicate whether/not cleanup timed out. The graph of this measure however, represents the same using the numeric equivalents only. |
||||||||
|
Total backlogged tables |
Indicates the number of tables on which cleanup was incomplete. |
Number |
This measure indicates the number of tables on which cleanup occurred, but could not delete all the records that were marked for deletion. This can happen if a table contains too many records to be deleted. In such circumstances, the eG manager cleans up a few records from the table each day for the next few days. Use the detailed diagnosis of this measure to know which tables have records that are yet to be cleaned by cleanup. |
||||||||
|
Total tables that failed cleanup |
Indicates the number of tables on which cleanup failed. |
Number |
Ideally, the value of this measure should be 0. A non-zero value is indicative of cleanup failures. Use the detailed diagnosis of this measure to isolate the tables on which cleanup failed. |
The detailed diagnosis of the Total successfully cleaned tables measure lists the tables that were successfully cleaned and the time taken by the cleanup process to clean each table.
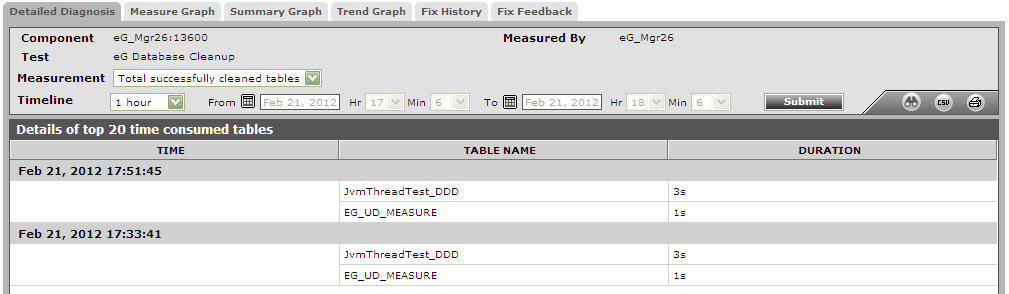
Figure 1 : The detailed diagnosis of the Total successfully cleaned tables measure
The detailed diagnosis of the Total backlogged tables measure lists the tables on which cleanup was incomplete. For each table, the detailed diagnosis also provides the number of days of data from the table that is yet to be cleaned and number of days of data that has already been cleaned.
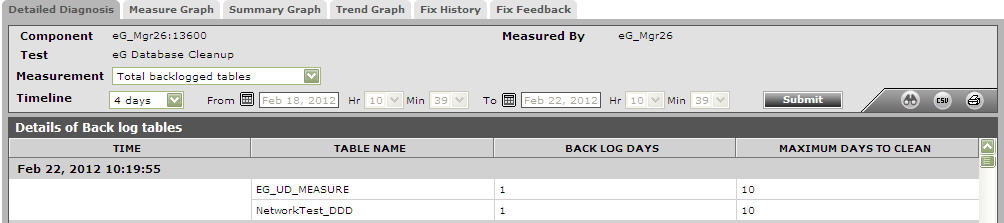
Figure 2 : The detailed diagnosis of the Total backlogged tables measure