eG Infrastructure Test
This test auto-discovers the applications managed by the eG Enterprise system, automatically categorizes the applications into pre-configured categories, and for every category, reports the total number of managed, unmanaged, and deleted components. The test also tracks the recent management activity on the eG Enterprise system by reporting the number of components that were managed, unmanaged, and deleted, recently. Detailed diagnostics reveals the names of components managed, unmanaged, and deleted.
Target of the test : The eG Manager
Agent deploying the test : An internal/remote agent
Outputs of the test : One set of results for each category of components managed by the eG manager being monitored.
| Parameter | Description |
|---|---|
|
Test period |
How often should the test be executed . |
|
Host |
The host for which the test is to be configured. |
|
Port |
The port number at which the specified host listens. |
|
JMX Remote Port |
Here, specify the port at which the JMX listens for requests from remote hosts. In the <EG_MANAGER_INSTALL_DIR>\manager directory (on Windows; on Unix, this will be the /opt/egurkha/manager directory) of the eG manager, you will find a management.properties file. Set the port defined against the com.sun.management.jmxremote.port parameter of the file as the JMX Remote Port. |
|
User, Password, and Confirm Password |
By default, JMX requires no authentication or security. Therefore, the User, Password , and Confirm Password parameters are set to none by default. |
|
JNDIName |
The JNDIName is a lookup name for connecting to the JMX connector. By default, this is jmxrmi. If you have registered the JMX connector in the RMI registry using a different lookup name, then you can change this default value to reflect the same. |
|
JMX Provider |
This test uses a JMX Provider to access the MBean attributes of the eG manager and collect metrics. Specify the package name of this JMX Provider here. By default, this is set to com.sun.jmx.remote.protocol. |
|
Timeout |
Specify the duration (in seconds) for which this test should wait for a response from the eG manager. If there is no response from the eG manager beyond the configured duration, the test will timeout. By default, this is set to 240 seconds. |
|
DD Frequency |
Refers to the frequency with which detailed diagnosis measures are to be generated for this test. The default is 1:1. This indicates that, by default, detailed measures will be generated every time this test runs, and also every time the test detects a problem. You can modify this frequency, if you so desire. Also, if you intend to disable the detailed diagnosis capability for this test, you can do so by specifying none against DD frequency. |
|
Detailed Diagnosis |
To make diagnosis more efficient and accurate, the eG Enterprise embeds an optional detailed diagnostic capability. With this capability, the eG agents can be configured to run detailed, more elaborate tests as and when specific problems are detected. To enable the detailed diagnosis capability of this test for a particular server, choose the On option. To disable the capability, click on the Off option. The option to selectively enable/disable the detailed diagnosis capability will be available only if the following conditions are fulfilled:
|
| Measurement | Description | Measurement Unit | Interpretation |
|---|---|---|---|
|
Total managed components |
Indicates the total number of components of this category that are managed by the eG manager. |
Number |
Use the detailed diagnosis of this measure to know how many components of which component type are being managed by the eG manager. |
|
Recently managed components |
Indicates the number of components of this category that were managed during the last measurement period. |
Number |
Use the detailed diagnosis of this measure to know how many components of which component type were managed in the last measurement period. |
|
Total unmanaged components |
Indicates the total number of components of this category that are unmanaged. |
Number |
Use the detailed diagnosis of this measure to know how many components of which component type are unmanaged. |
|
Recently unmanaged components |
Indicates the number of components of this category that were unmanaged during the last measurement period. |
Number |
Use the detailed diagnosis of this measure to know how many components of which component type were recently unmanaged. |
|
Total deleted components |
Indicates the total number of components of this category that have been deleted. |
Number |
Use the detailed diagnosis of this measure to know how many components of which component type have been deleted. |
|
Recently deleted components |
Indicates the number of components of this category that were deleted during the last measurement period. |
Number |
Use the detailed diagnosis of this measure to know how many components of which component type were recently deleted. |
The detailed diagnosis of the Total managed components measure displays the number of components of each component type that are being managed.
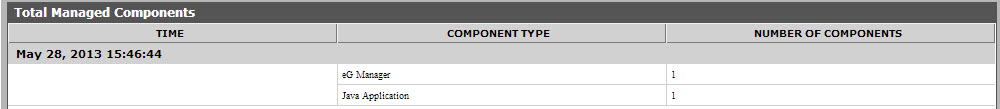
Figure 11 : The detailed diagnosis of the Total managed components measure
The detailed diagnosis of the Total unmanaged components measure displays the number of components of each component type that have been unmanaged.

Figure 12 : The detailed diagnosis of the Total unmanaged components measure
The detailed diagnosis of the Total deleted components measure displays the number of components of each component type that have been deleted.

Figure 13 : The detailed diagnosis of the Total deleted components measure
The detailed diagnosis of the Recently managed components measure displays the number of components of each component type that were managed during the last measurement period.

Figure 14 : The detailed diagnosis of the Recently managed components measure
The detailed diagnosis of the Recently unmanaged components measure displays the number of components of each component type that were unmanaged during the last measurement period.

Figure 15 : The detailed diagnosis of the Recently unmanaged components measure