eG User Logons Test
Where eG manager is used for monitoring, administrators need to be able to quickly and easily login to the eG manager, so that they can view the health of their environment on-demand. If administrators are unable to login to the eG manager when in need, then the administrators can not monitor the health of the components and proactively find out the issues. Also, frequent logon issues may force administrators to question the reliability of the eG manager. To ensure that administrators access the eG manager without any glitch, administrators should promptly capture logon issues, isolate its root cause, and rapidly initiate measures to address it. This is where the eG User Logons test helps!
Using this test, administrators can figure out how many login attempts to the eG manager are successful and how many login attempts failed. The detailed diagnosis revealed by this test helps administrators to find out the reason on why the login attempts failed.
Outputs of the test : One set of results for the eG manager that is being monitored.
| Parameter | Description |
|---|---|
|
Test period |
How often should the test be executed . |
|
Host |
The host for which the test is to be configured. |
|
Port |
The port number at which the specified host listens. |
|
JMX Remote Port |
Here, specify the port at which the JMX listens for requests from remote hosts. In the <EG_MANAGER_INSTALL_DIR>\manager directory (on Windows; on Unix, this will be the /opt/egurkha/manager directory) of the eG manager, you will find a management.properties file. Set the port defined against the com.sun.management.jmxremote.port parameter of the file as the JMX Remote Port. |
|
JMX User, JMX Password, and Confirm Password |
By default, JMX requires no authentication or security. Therefore, the User, Password , and Confirm Password parameters are set to none by default. |
|
JNDIName |
The JNDIName is a lookup name for connecting to the JMX connector. By default, this is jmxrmi. If you have registered the JMX connector in the RMI registry using a different lookup name, then you can change this default value to reflect the same. |
|
Provider |
This test uses a JMX Provider to access the MBean attributes of the eG manager and collect metrics. Specify the package name of this JMX Provider here. By default, this is set to com.sun.jmx.remote.protocol. |
|
Timeout |
Specify the duration (in seconds) for which this test should wait for a response from the eG manager. If there is no response from the eG manager beyond the configured duration, the test will timeout. By default, this is set to 240 seconds. |
|
DD Frequency |
Refers to the frequency with which detailed diagnosis measures are to be generated for this test. The default is 1:1. This indicates that, by default, detailed measures will be generated every time this test runs, and also every time the test detects a problem. You can modify this frequency, if you so desire. Also, if you intend to disable the detailed diagnosis capability for this test, you can do so by specifying none against DD frequency. |
|
Detailed Diagnosis |
To make diagnosis more efficient and accurate, the eG Enterprise embeds an optional detailed diagnostic capability. With this capability, the eG agents can be configured to run detailed, more elaborate tests as and when specific problems are detected. To enable the detailed diagnosis capability of this test for a particular server, choose the On option. To disable the capability, click on the Off option. The option to selectively enable/disable the detailed diagnosis capability will be available only if the following conditions are fulfilled:
|
| Measurement | Description | Measurement Unit | Interpretation |
|---|---|---|---|
|
Successful logons |
Indicates the number of logon attempts that are successful. |
Number |
The detailed diagnosis of this measure reveals the name of user who tried to login to the eG manager, the name of host from which the user attempted to login, the interface used by the user and the time stamp at which the user logged in to the eG manager. |
|
Failed logons |
Indicates the number of logon attempts that failed. |
Number |
The detailed diagnosis of this measure reveals the name of user who tried to login to the eG manager, the name of host from which the user attempted to login, the interface used by the user, the time stamp at which the user logged in to the eG manager and the reason why the login attempts failed. |
The detailed diagnosis of the Successful logons measure reveals the name of user who tried to login to the eG manager, the name of host from which the user attempted to login, the interface used by the user and the time stamp at which the user logged in to the eG manager.
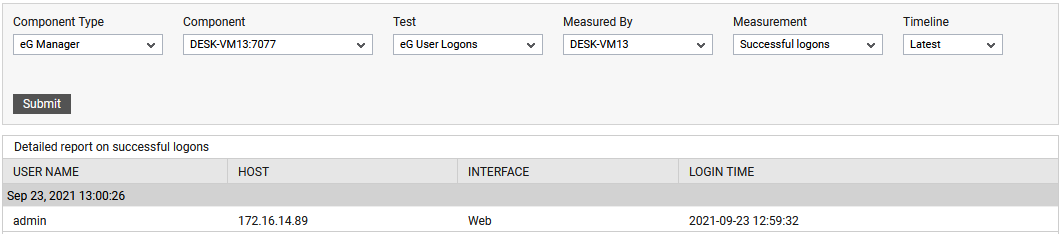
Figure 1 : The detailed diagnosis of the Successful logons measure
The detailed diagnosis of the Failed logons measure reveals the name of user who tried to login to the eG manager, the name of host from which the user attempted to login, the interface used by the user, the time stamp at which the user logged in to the eG manager and the reason why the login attempts failed.
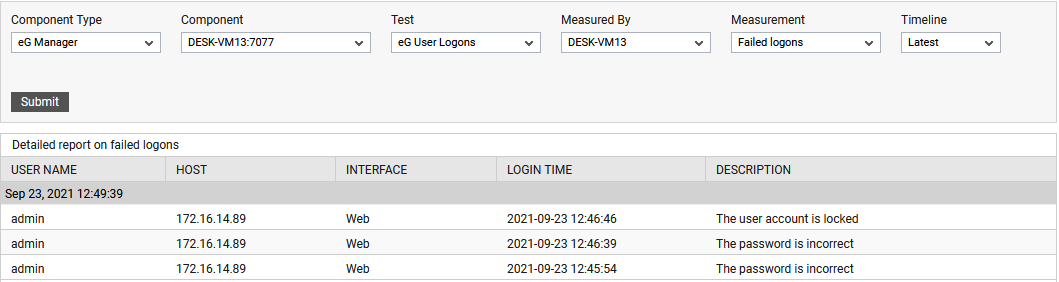
Figure 2 : The detailed diagnosis of the Failed logons measure