Specific Messages by Facility Test
eG Syslog server consolidates error/warning messages that are received from multiple systems in your environment into a single location. The error/warning messages are generated by any part/process of the system and are logged in the syslog file. The error/warning messages are broadly categorized on the basis of which process/part of the system generated the messages. In the Syslog server, this categorization is done using the concept called Facilities. These facilities are components of the systems and are represented by decimal integers. By referring to the values corresponding to these facilities, administrator can easily determine the part/process of the system that created the error/warning messages. Sometimes, administrator may only want to receive the messages from certain parts/processes of the system that are critical for the purpose of tracking performance of the system and for troubleshooting. In such cases, administrator can use the Specific Messages by Facility test to filter out the messages of his/her interest. This test enables administrator to specify a set of rules based on which the error/warning messages should be filtered.
This test periodically mines the syslog file according to the specific rules set by administrator and reports the number of messages that match each rule. This way, administrator is alerted to the errors/warnings triggered at any level of the system, and enabled to initiate the remedial measures before anything untoward happens.
This test is disabled by default. To enable the test, go to the enable / disable tests page using the menu sequence : Agents -> Tests -> Enable/Disable, pick eG Syslog as the Component type, set Performance as the Test type, choose the test from the disabled tests list, and click on the >> button to move the test to the ENABLED TESTS list. Finally, click the Update button.
Target of the test : eG Syslog Server
Agent deploying the test : An internal agent
Outputs of the test : One set of results for each rule set by administrator
| Parameter | Description |
|---|---|
|
Test Period |
How often should the test be executed |
|
Host |
The IP address of the host for which the test is being configured. |
|
Port |
The port at which the specified host listens. By default, this is NULL. |
|
Rule Name |
By default, the syslog file contains logs relating to multiple of host systems that are installed in your environment. In order to obtain the log information of your interest, you can define a set of rules according to which the messages should be read from the syslog file. To create a rule of your choice, click on the |
|
SyslogFile |
This test reports metrics by parsing the syslog file. Specify the full path to the syslog file here. For instance: C:\eGurkha\agent\syslog\syslog. |
|
RotatingFile |
By default, this parameter is set to No. To instruct the eG Enterprise system to monitor newer log files also, set this parameter to Yes. Otherwise, set it to No. |
|
DD frequency |
Refers to the frequency with which detailed diagnosis measures are to be generated for this test. The default is 1:1. This indicates that, by default, detailed measures will be generated every time this test runs, and also every time the test detects a problem. You can modify this frequency, if you so desire. Also, if you intend to disable the detailed diagnosis capability for this test, you can do so by specifying none against DD Frequency. |
|
Detailed Diagnosis |
To make diagnosis more efficient and accurate, the eG Enterprise embeds an optional detailed diagnostic capability. With this capability, the eG agents can be configured to run detailed, more elaborate tests as and when specific problems are detected. To enable the detailed diagnosis capability of this test for a particular server, choose the On option. To disable the capability, click on the Off option. The option to selectively enable/disable the detailed diagnosis capability will be available only if the following conditions are fulfilled:
|
| Measurement | Description | Measurement Unit | Interpretation |
|---|---|---|---|
|
Number of Messages |
Indicates the number of messages in the specified Syslog file that matched this rule. |
Number |
The detailed diagnosis of this measure reveals the host IP, the time stamp and the log message. |
Configuring Rules for Monitoring
To configure the rules, do the following:
-
Click on the
 icon in the Figure 1.
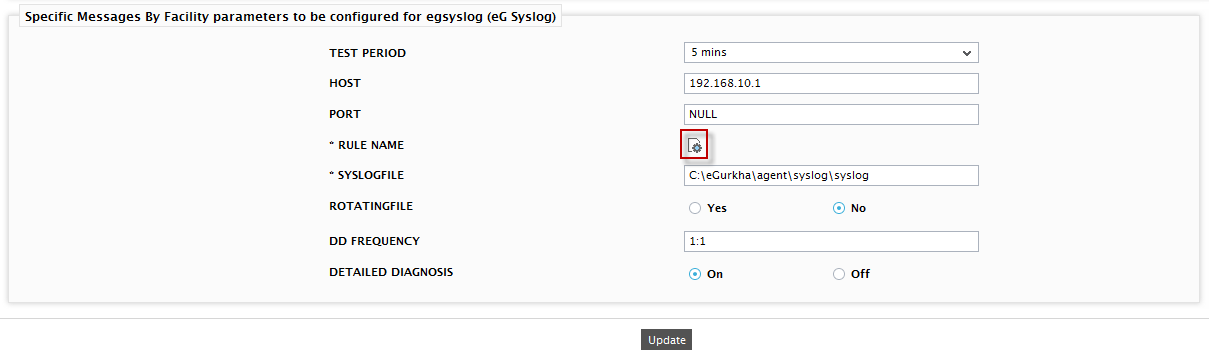
Figure 1 : Configuring the Specific Messages By Facility test
-
In the popup window that appears, specify the values as shown in Figure 2.
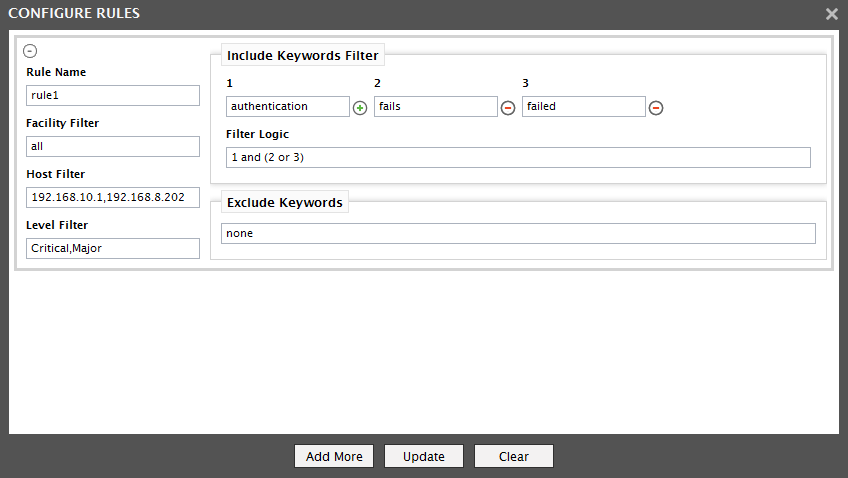
- Rule Name : Specify a name for the rule which will appear as the descriptor in the test.
- Facility Filter : By default, this is set to all indicating that all the facilities will be monitored by default. If you wish to filter the messages from any particular facility, then, specify the name of that particular facility in this text box. For example: kern. In this case, the messages belong to the kernal level will only be monitored. Besides, you can also filter the messages from multiple facilities of your choice by specifying the names of those facilities in a comma-separated list. For example, kern,user,mail.
- Host Filter : Here, specify the IP address of the host system for which the messages collected should be filtered from the syslog file. By default, this is set to all indicating that messages from all the host systems will be tracked. Multiple host systems of your choice can also be given in a comma-separtated list. Your specification should be of the following format: 192.168.10.1,192.168.8.202
- Level Filter : The error/warning messages logged in the syslog file have various degrees of severity. In this text box, indicate a severity level to check for the error/warning messages with particular degree of severity in the syslog file. By default, this is set to all indicating that all the messages will be monitored regardless of their degree of severity. You can also specify multiple severity levels as a comma-separated list in the following format: Critical,Major.
- Include Keywords Filter : Specify one or more keywords to be monitored from the syslog file in this section. By default, this section would be provided with one field wherein you will have to specify a keyword to be monitored. However, to add more keywords, click on the
 button and add the keywords in the fields that are added. For instance, if you want to search for the authentication failure related messages, then you can specify the keywords as shown in Figure 2. Using the
  button, you can remove the keywords that you added.
 - Filter logic - Here, you can define a logic on how to filter out messages in the syslog file. This logic is derived based on the keywords that you provided in the Include Keywords Filter section. For instance, assume that the Filter Logic is 1 and (2 or 3) as shown in Figure 2. Here, the messages will be filtered only if the messages contain the keyword 1 and either of the keyword 2 or keyword 3. Likewise, you can define any filter logic according to your need.
- Exclude Keywords : Here, specify a comma-separated list of keywords to be excluded from monitoring. The format of your specification should be: error,warning. By default, this is set to none indicating that no messages will be excluded from monitoring.
Once you clicked the Update button after defining all the values, you will return to the test configuration page. To add more rules, click on the Add More button in Figure 2. If you want to clear the values that you entered and define the new values, you can do so by using the Clear button. You can also remove a specific rule that you added, using the  button.