Provider VDC Details Test
A Provider vDC (PvDC) is used to provide a single type of compute resources and a single type of storage resources. PvDCs are created for segmenting resources based on resource characteristics. A PvDC can be used to define availability and SLAs based around performance. These are then mapped back to a cluster or resource pool at the vSphere layer.
This test reports the compute capacity and storage capacity of the provider virtual DataCenters (provider vDCs) connecting to the vCloud Director. Also, this test throws light on the status of the provider vDC, verifies whether this provider vDC is enabled/not, and also periodically checks whether the compute capacity of the provider vDC is capable of growing/shrinking based on demand.
Target of the test : A vCloud Director Cell
Agent deploying the test : An internal/remote agent
Outputs of the test : One set of results for each Provider vDC.
| Parameter | Description |
|---|---|
|
Test Period |
How often should the test be executed. |
|
Host |
The host for which the test is being configured. |
|
Port |
Specify the port at which the specified host listens in the Port text box. By default, this is NULL. |
|
vCloud Director User |
Specify the name of the user with Administrator access to the target vCloud Director Cell. |
|
vCloud Director Pass |
Enter the password of the specified vCloud Director User. |
|
Confirm password |
Confirm the password by retyping it here. |
|
SSL |
By default, the vCloud Director Cell is SSL-enabled. Accordingly, the SSL flag is set to Yes by default. |
|
Detailed Diagnosis |
To make diagnosis more efficient and accurate, the eG Enterprise embeds an optional detailed diagnostic capability. With this capability, the eG agents can be configured to run detailed, more elaborate tests as and when specific problems are detected. To enable the detailed diagnosis capability of this test for a particular server, choose the On option. To disable the capability, click on the Off option. The option to selectively enable/disable the detailed diagnosis capability will be available only if the following conditions are fulfilled:
|
| Measurement | Description | Measurement Unit | Interpretation | ||||||||||||
|---|---|---|---|---|---|---|---|---|---|---|---|---|---|---|---|
|
Status |
Indicates the current status of this provider vDC. |
|
The values this measure can report and their numeric equivalents have been listed in the table below:
Note: By default, this measure reports the above-mentioned Measure Values while indicating the current status of a provider vDC. However, in the graph of this measure, the status will be represented using the corresponding numeric equivalents only. |
||||||||||||
|
Is Elastic? |
Indicates whether/not this provider vDC is elastic. |
|
An Elastic vDC allows you to add more resources to a Provider vDC when they become consumed/constrained. This only works with the Pay-as-you-go Allocation model. When you opt for this model, it implies that you have little knowledge as a provider on how many VMs will be deployed. Potentially, there is the possibility that all your resources will be consumed, and your consumers will not be able to deploy any more workloads. This is where Elastic vDCs come in, as it allows you to add more resources to a PvDC on the fly. This measure reports the value Yes if the provider vDC is elastic, and the value No if it is not. The numeric values for the above mentioned states are represented in the table below:
Note: By default, this measure reports the above-mentioned States while indicating whether/not the provider vDC is elastic or not. However, in the graph of this measure, states will be represented using their corresponding numeric equivalents only. |
||||||||||||
|
Is HA? |
Indicates whether/not the vSphere cluster from which this provider vDC derives its resources is an HA-enabled cluster. |
|
This measure reports the value Yes if the vSphere cluster mapped to the Provider vDC is HA-enabled, and the value No if it is not. The numeric values for the above mentioned states are represented in the table below:
Note: By default, this measure reports the above-mentioned States while indicating whether/not the vSphere cluster mapped to a provider vDC is HA-enabled. However, in the graph of this measure, states will be represented using their corresponding numeric equivalents only. |
||||||||||||
|
Is Enabled? |
Indicates whether/not this provider vDC is currently enabled with the vCloud Director. |
|
This measure reports the value Yes if the provider vDC is currently enabled, and the value No if it is disabled. The numeric values for the above mentioned states are represented in the table below:
Note: By default, this measure reports the above-mentioned States while indicating whether/not the provider vDC is enabled. However, in the graph of this measure, states will be represented using their corresponding numeric equivalents only. |
||||||||||||
|
Datastores in PvDC |
Indicates the number of datastores in this pVDC. |
Number |
Use the detailed diagnosis of this measure to know which datastores are mapped to this pVDC. |
||||||||||||
|
Organization vDC |
Indicates the number of organization vDCs provisioned from this pVDC. |
Number |
The detailed diagnosis of this measure lists out the names of the organization vDCs that are provisioned from this provider vDC. |
||||||||||||
|
Total CPU |
Indicates the CPU units that are allocated for consumption in this provider vDC. |
Mhz |
|
||||||||||||
|
CPU used |
Indicates the CPU that is currently in use in this provider vDC. |
Mhz |
A very high value for these measures indicates the excessive usage of a pVDC by the org vDCs that are mapped to it. Compare the value of this measure to isolate the CPU-hungry pvDCs. |
||||||||||||
|
CPU Used Percentage |
Indicates the percentage of CPU resources in this pVDC that is currently in use. |
Percent |
|||||||||||||
|
CPU Allocation |
Indicates the CPU units that are currently allocated to the Org vDCs mapped to this pVDC. |
Mhz |
The detailed diagnosis of this measure lists out the Organization, Organization vDC and the CPU allocated to each of the Organization vDC. |
||||||||||||
|
CPU Allocation Percentage |
Indicates the percentage of CPU resources of this pVDC that is allocated to the Org vDCs mapped to it. |
Percentage |
|
||||||||||||
|
CPU Overhead |
Indicates the CPU units that are allocated to the vShield Manager for connecting to the VMs that are provisioned from this provider vDC. |
Mhz |
|
||||||||||||
|
Total Memory |
Indicates the maximum amount of memory that is allocated for consumption in this provider vDC. |
MB |
|
||||||||||||
|
Memory Used |
Indicates the amount of memory that currently in use in this pvDC. |
MB |
A very high value for these measures indicates the excessive usage of the memory resources in a pvDC by the Org vDCs mapped to it. Compare the value of each of these measures across pvDCs to isolate the memory-hungry pvDCs. |
||||||||||||
|
Memory Used Percentage |
Indicates the percentage of memory that is currently used in this pvDC. |
Percent |
|||||||||||||
|
Memory Allocated |
Indicates the amount of memory that is currently allocated to the Org vDCs mapped to this pVDC. |
MB |
The detailed diagnosis of the this measure lists the org vDCs mapped to a provider vDC, the organization to which each org vDC belongs, and the amount of memory allocated to every org vDC.
|
||||||||||||
|
Memory Allocation Percentage |
Indicates the percentage of memory in this pVDC that is currently allocated to the Org vDCs mapped to it. |
|
|
||||||||||||
|
Memory Overhead |
Indicates the percentage of memory that is allocated to the vShield Manager for connecting to the VMs that are provisioned from this provider vDC. |
Percent |
|
||||||||||||
|
Total Storage |
Indicates the maximum number of storage units that are allocated for consumption in this provider vDC. |
GB |
|
||||||||||||
|
Storage Used |
Indicates the amount of storage space that is currently in use in this pvDC. |
GB |
A very high value for this measure indicates the excessive usage of the storage space in an pVDC by the Org vDCs mapped to it. Compare the value of this measure to isolate the pvDCs that could potentially require more space. |
||||||||||||
|
Storage Used Percentage |
Indicates the percentage of storage that is currently used in this pvDC. |
Percent |
|||||||||||||
|
Storage Allocated |
Indicates the amount of storage units currently allocated to the Org vDCs mapped to this pvDC. |
GB |
The detailed diagnosis of the Storage Allocated measure lists the org vDCs mapped to a provider vDC, the organization to which each org vDC belongs, and the amount of storage space allocated to every org vDC.
|
||||||||||||
|
Storage Allocation Percentage |
Indicates the percentage of storage that is currently allocated to the org vDCs mapped to this pvDC. |
Percent |
|
||||||||||||
|
Storage Overhead |
Indicates the amount of memory that is allocated to the vShield Manager for connecting to the VMs that are provisioned from this provider vDC. |
GB |
|
The detailed diagnosis of the Datastores in pVDC measure displays the names of datastores that are mapped to a particular pvDC.
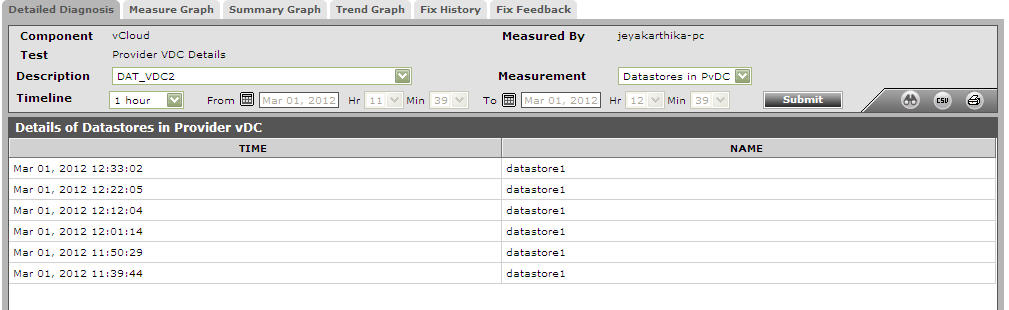
Figure 1 : The detailed diagnosis of the Datastores in pVDC measure
The detailed diagnosis of the Organization vDC measure reports the names of organization vDCs that are mapped to a particular vDC.
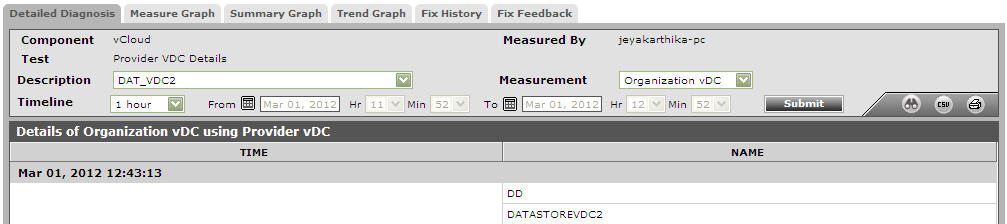
Figure 2 : The detailed diagnosis of the Organization vDC measure
The detailed diagnosis of the CPU Allocation measure lists the org vDCs mapped to a provider vDC, the organization to which each org vDC belongs, and the CPU allocated (in MHz) to every org vDC.
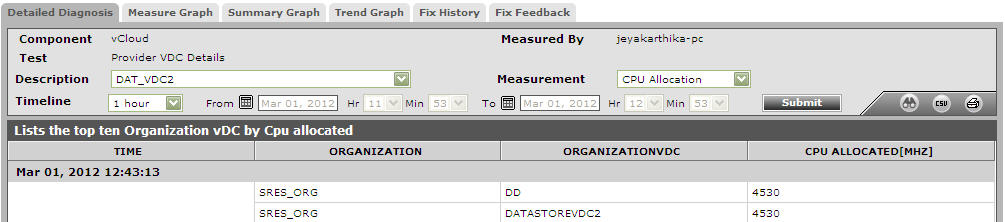
Figure 3 : The detailed diagnosis of the CPU Allocation measure
The detailed diagnosis of the Memory Allocated measure lists the org vDCs mapped to a provider vDC, the organization to which each org vDC belongs, and the amount of memory allocated to every org vDC.
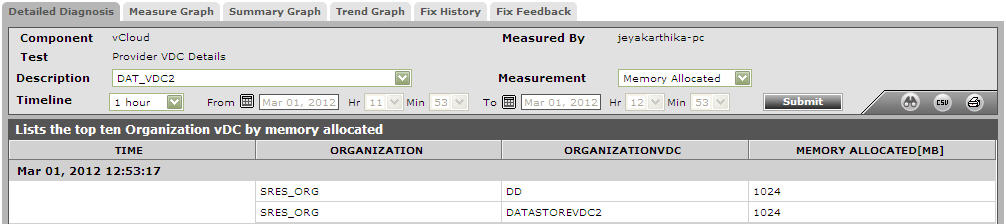
Figure 4 : The detailed diagnosis of the Memory Allocated measure
The detailed diagnosis of the Storage Allocated measure lists the org vDCs mapped to a provider vDC, the organization to which each org vDC belongs, and the amount of storage space allocated to every org vDC.
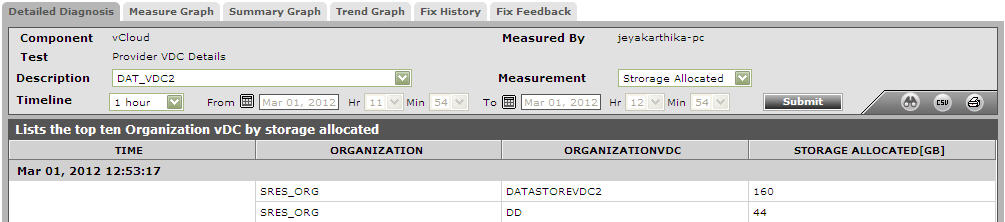
Figure 5 : The detailed diagnosis of the Storage Allocated measure