Quickly get to the root-cause of Java application problems and discover if it's the code, database queries, JVMs, or the underlying infrastructure that's causing slow application response to users.
Trusted by leading companies

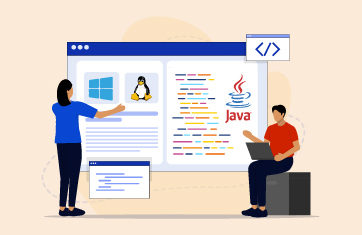
Many server-side applications are written in Java and process tens of millions of requests per day. Key applications in various domains like finance, healthcare, insurance and education are Java-based. When these applications slow down, they affect the user experience and in turn, reduce business revenue.
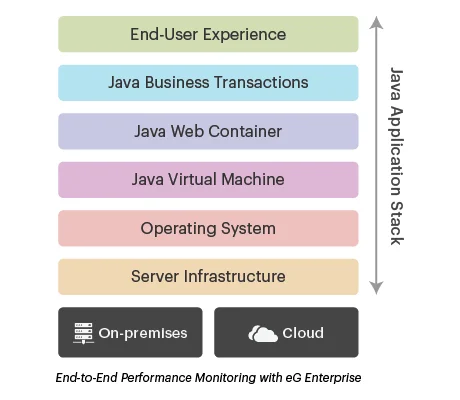
IT operations, application operations and DevOps teams often spend days troubleshooting Java application performance issues. Since Java applications are multi-threaded and involve multi-tier architectures, it is a challenge to identify whether the problem is due to the client, the network, in the JVM, in the application code, with the SQL query, or in the underlying infrastructure. Monitoring of the Java application stack end-to-end is necessary to ensure peak application performance and user satisfaction.


eG Enterprise provides a powerful and easy-to-use set of Java performance monitoring tools that address the key needs of IT operations, Application operations and DevOps teams.

eG Enterprise is an end-to-end APM solution for Java applications. With its integrated application and infrastructure monitoring capabilities, you can:
With eG Enterprise, we can now quickly identify root causes of incidents, resolving them before users are impacted. Automatic prioritization and categorization of alerts helps us better focus on the important issues and prioritize our resources accordingly.![]()


Using an advanced tag-and-follow approach, eG Enterprise traces every business transaction (from web browsers and native mobile apps) that flows through the Java web and middleware tiers and allows quick identification of the cause of transaction slowness.

Monitor all aspects of the health and performance of Java web containers hosting the applications and the underlying Java Virtual Machines (JVMs).

Application performance is often affected by anomalies in the underlying IT infrastructure, including the server operating system, hardware, hypervisor, network, and storage devices. In such cases, monitoring tools that only look at the application layers will not be helpful.
Using a converged approach to application and infrastructure monitoring, eG Enterprise allows IT administrators to monitor, analyze and correlate application performance with infrastructure performance. From a unified web console, administrators can see the performance every layer and every tier. A patented auto-correlation engine analyzes performance insights, presents a visual topology map of the infrastructure including interdependencies across the various tiers, and pinpoints the root cause in seconds.

Java performance monitoring refers to the monitoring of all the layers of a Java application in order to determine how well it is performing and where bottlenecks might be. Java performance monitoring includes monitoring of the Java virtual machine, the web application server (if applicable), and application transactions. By unearthing bottleneck, Java performance monitoring allows developers and application operations teams to fine-tune the code and the application configuration to deliver better performance.
Yes, monitoring of the JVM is possible and is in fact very important. Application developers, Application operations staff and others need to monitor all JVMs used in production. Typically, JVM monitoring is used on Java Management Extensions (JMX) interfaces supported by the JVM. To learn how to monitor the JVM, see https://www.eginnovations.com/supported-technologies/jvm-monitoring
JVM monitoring must track the overall CPU usage of the JVM and if there is a high CPU usage scenario, it should highlight which thread(s) is (are) taking CPU. Read more about troubleshooting Java CPU usage issues here.
JVM monitoring also must track the state of all threads running in the JVM. If there are excessive runnable, blocked, deadlocked threads, these situations need to be highlighted to IT admins. Read more about Java threads here.
Monitoring of heap memory usage in the JVM is extremely important. If the JVM is not sized correctly and if the heap usage is close to 100%, the performance of Java applications running on the JVM will be extremely slow. See how to address JVM memory issues in our top 10 Java performance issues blog.
Finally, Java Garbage Collection (GC) needs to be monitored as well. Excessive GC may be an indicator of memory leaks in the application.
No. Monitoring of the JVM is not sufficient. Most applications are run on Java application servers like Tomcat, JBoss, WebLogic, WebSphere, etc. Performance bottlenecks in these application servers can affect application performance. For instance, the maximum number of threads to be used by the application server is a configuration setting. If this value is too low, this will cause performance bottlenecks. Check out these blogs to see how to tune JBoss, Tomcat and WebLogic application servers for maximum performance.
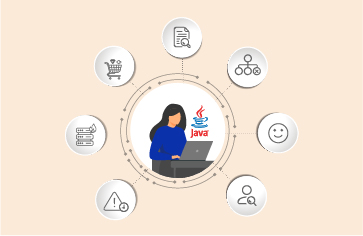
Key metrics of a Java application’s performance include availability (i.e., is it responding to user requests), latency/response time to requests (i.e., how quickly do users receive responses) and throughput (i.e., how many requests are serviced in a given period of time).
No, Java performance monitoring applies to any Java application – whether it is web-based or standalone. Specific aspects of monitoring may apply only to web applications – e.g., a standalone Java application may not use a web application server like Oracle WebLogic, Apache Tomcat, JBoss, etc.
Java Server Pages (JSPs) are converted to compiled code and processed. Hence, all the Java monitoring techniques mentioned above are applicable.
No, Java performance monitoring does not require any changes to the application code. JVM metrics (garbage collection, threads, classes, memory leaks, etc.) are collected using Java Management Instrumentation (JMX) APIs. Application server monitoring is performed using APIs supported by the application server. Application transaction tracing is done using byte-code instrumentation which is performed in a manner transparent to the application code, yet allows monitoring tools to track every database query, every Java method call, and so on.
Monitoring the application server and JVM is not very expensive. Typical CPU overhead is 0.1-0.3% on an average. Transaction tracing is more expensive as every request has to be traced. Resource usage for this is 1-3%.
Yes, there are many free tools for monitoring Java applications. Here is an interesting blog that describes the most popular free Java monitoring tools.
The best Java application monitoring tool depends on your requirements. There are dozens of monitoring tools available, from free tools that monitor specific processes, to comprehensive end-to-end application performance monitoring tools like eG Enterprise. If performance, uptime and digital experience are important to you, then you should consider eG Enterprise for your Java performance monitoring.
Monitoring your Java CPU usage can be done with simple free tools like JConsole. However, monitoring resource usage like CPU and memory is monitoring the symptom of an underlying cause. To truly understand your Java application performance you should use a complete Java application performance monitoring tool that can analyze your application code to help identify processes that are causing CPU and memory spikes.
Monitoring your Java memory usage can be done with simple free tools like JConsole. Many free tools provide inputs to the administrator and require 24x7 oversight to detect problems. Typically for production environments, you need enterprise-class monitoring tools like eG Enterprise that can track the health of 100s of Java applications simultaneously, can provide proactive alerting and do not need constant manual supervision.
Yes, Java application performance monitoring can highlight threads (and code) that are taking excessive CPU, indicate if the JVM is not sized correctly (e.g., Java memory heap is too small), point out database queries that are not optimal, indicate Java methods that are taking more time, etc. By acting on these inputs, you can tune your Java application and improve its performance.
Commercial tools have different licensing models. While some license by CPU cores, sockets, etc. on a server, others require a license for each Java application instance. eG Enterprise Java performance monitoring is licensed by OS (for physical machines and virtual machines) and by nodes (for containerized environments). This makes eG Enterprise a lot more cost-effective than other solutions.