Event correlation in the context of an AIOps (Artificial Intelligence for IT Operations) monitoring tool, such as eG Enterprise, is the automated process of analyzing and linking related IT events to identify patterns, root causes, and significant incidents within complex IT environments. By correlating events from various sources (like servers, applications, networks, and databases), AIOps tools help IT teams manage alerts more efficiently, reduce noise, and address issues faster and more effectively.
Event Correlation – An Analogy
Imagine you are a beach lifeguard, and you notice two things: ice cream sales are skyrocketing, and shark attacks are happening more often. These events are correlated — they’re happening around the same time. But does buying ice cream cause shark attacks? Does eating ice cream make you a tastier shark-snack? …. Of course not! The real cause is hot weather, which leads people to both eat more ice cream and go swimming more.
Understanding and differentiating “Correlation” from “Causation” is an incredibly important concept in AIOps. Well-architected tools such as eG Enterprise are designed to not only offer insights via correlation but also determine causation with Root Cause Analysis (RCA). See: The Logical Fallacy of Correlation Versus Causation for some more details on the fundamental concepts.
 It is also worth grasping the basics of “reverse causation” whereby an effect may be confused with a cause. One factor complicating the study of zero-calorie beverages and weight loss is this “reverse causation.” People at risk of, or living, with obesity tend to choose these beverages, making it appear that these drinks are to blame.
Event Correlation vs Causation
- Correlation means two things happen together.
- Causation means one thing makes another thing happen.
- Just because two things are correlated doesn’t mean one causes the other — they might happen together by coincidence, due to a third factor, or even in reverse order.
So, it’s important to be cautious when interpreting correlations, especially when deciding if one thing actually causes another.
Making Sense of Events with Event Correlation
 Today’s monitoring solutions often provide basic charting and reporting features, displaying metrics through graphs and visualizations. Terms like “root-cause analysis” and “correlation” frequently appear, but the critical question is how these analyses are performed—and by whom. The true cost of monitoring often arises from the need to rely on skilled IT professionals to interpret data and derive insights, essentially manually undertaking the complex task of event correlation. With modern distributed systems, manually making sense of vast streams of events is simply unfeasible.
The Role of AIOps in Modern Event Correlation
Many organizations assume that terms like “root-cause analysis” imply some level of automation. However, as discussed above, traditional monitoring tools often depend on manual correlation, where IT staff review logs and graphs to identify issues. This approach is labor-intensive, time-consuming, and doesn’t scale as infrastructure expands. This is why AIOps (Artificial Intelligence for IT Operations) is now being used in the field, automating event correlation and analysis to improve efficiency, scalability, and insight.
Approaches to Event Correlation
There are numerous approaches to event correlation, significant examples include:
Rule-Based Correlation
One traditional approach is rule-based, circuit-based or network-based correlation. These types of correlation involve using predefined rules that specify how to analyze and respond to certain events. While effective in static environments, this approach becomes increasingly impractical as infrastructure and data volume expand. Maintaining rule-based systems requires extensive time and effort to update rule sets, especially in today’s dynamic (and often auto-scaled) environments, where frequent changes require continuous adjustments to the rule-base.
History-Based Correlation
A more advanced method uses historical data to recognize patterns, employing techniques such as machine learning and analytics. This approach identifies recurring issues by drawing on past data, so if the same pattern occurs again, the system can quickly isolate the root cause. However, without the adaptive learning seen in AIOps, history-based correlation may fall short in dynamic environments (such as containerized ones like Kubernetes or OpenShift), as it relies heavily on known patterns. When new issues arise, or novel patterns appear, this approach may not offer meaningful insights or automatic correlation.
Domain-Based Correlation
Domain-based correlation organizes monitoring data based on layered dependencies and timing relationships, creating a topology-aware model. This approach improves the accuracy of correlation by analyzing interdependencies and event timings across a system’s components. Since this model doesn’t rely on static rules, it adapts to changing relationships, like virtual-to-physical dependencies in cloud environments. When paired with AIOps, domain-based correlation becomes more potent, as AIOps algorithms can continuously refine dependency mapping based on real-time data, further enhancing the precision of root-cause analysis.
AIOps-Driven Event Correlation
AIOps combines AI and machine learning, statistical methods and other techniques, with monitoring and event management to automate data analysis. By continuously learning from historical data and patterns, AIOps tools can detect anomalies and potential issues in real-time, freeing up IT teams from manual analysis. This method is dynamic and adapts to new patterns without needing pre-defined rules, making it ideal for rapidly changing environments. Through AIOps, monitoring systems can predict issues, auto-correlate events, and often pinpoint root causes autonomously, enhancing scalability as infrastructures grow.

Why AIOps is Essential for Modern Monitoring
As organizations scale their IT environments, the complexity of event data makes manual correlation unsustainable. AIOps-driven correlation brings automation and predictive analysis to event correlation, enabling real-time insights and reducing the need for constant rule-base updates. By leveraging machine learning, AIOps identifies hidden patterns and adapts to new ones, providing IT teams with actionable, granular information without requiring manual intervention. In dynamic virtual and cloud-based infrastructures, AIOps-enhanced correlation tools become indispensable, offering an agile, intelligent solution for robust root-cause analysis and automated event correlation.

Key Components of Event Correlation within AIOps
A comprehensive monitoring and observability tool such as eG Enterprise must include key AIOps features and capabilities, including:
-
Data Collection from Multiple Sources: AIOps platforms gather data from numerous sources, including logs, metrics, traces, performance data, alerts, and incidents from various systems. These might be from on-premises systems, multi-cloud environments, applications, endpoints, databases and network components. eG Enterprise is unique in its full-stack and end-to-end coverage, offering both breadth and depth with integrations for over 500+ technology stacks. If you are monitoring DEX (Digital Employee Experience) on the endpoints but aren’t ingesting data from the databases backing apps, the cloud apps run on, the networking hardware and so on – you simply don’t have the full set of data to correlate to perform root-cause analytics on.
-

Digital Workspace
Monitoring (DWP)Monitor, diagnose and report on any digital workspace to ensure your employees can remain productive.
-

Cloud & Hybrid Cloud Monitoring
Accelerate cloud migration and optimize performance across hybrid and multi-cloud architectures with confidence.
-

Digital Experience
MonitoringMonitor the end-user experience of customers and employees with real user monitoring and synthetic simulation.
-

Application Performance Monitoring (APM)
Monitoring that detects, diagnoses, and resolves application performance issues before end-users are affected.
-

Infrastructure
MonitoringSee everything that’s happening in your IT deployment and quickly troubleshoot server, database and network issues.
-

Enterprise Applications Monitoring
Boost business productivity on SAP, SharePoint, Office 365, and other enterprise applications.
-
Pattern Recognition and Clustering: Using machine learning, AIOps tools identify patterns and group similar events that may be indicators of the same issue. For example, if multiple alerts originate from the same server or application component, they are likely related and can be clustered into a single, actionable alert.
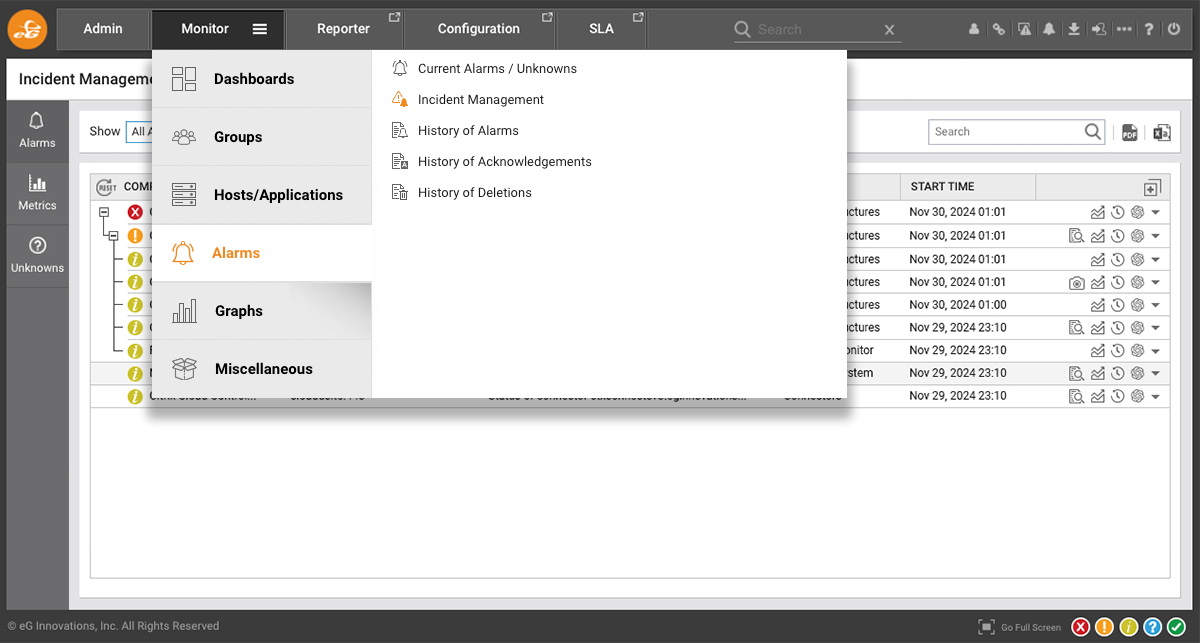
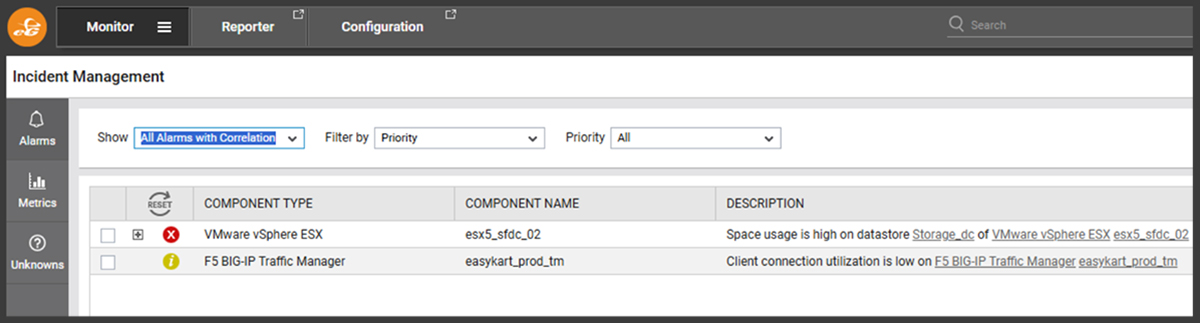
You can see how this methodology plays out with the eG Enterprise console. From the Monitor tab, operators can access the “Incident Management” dashboard.

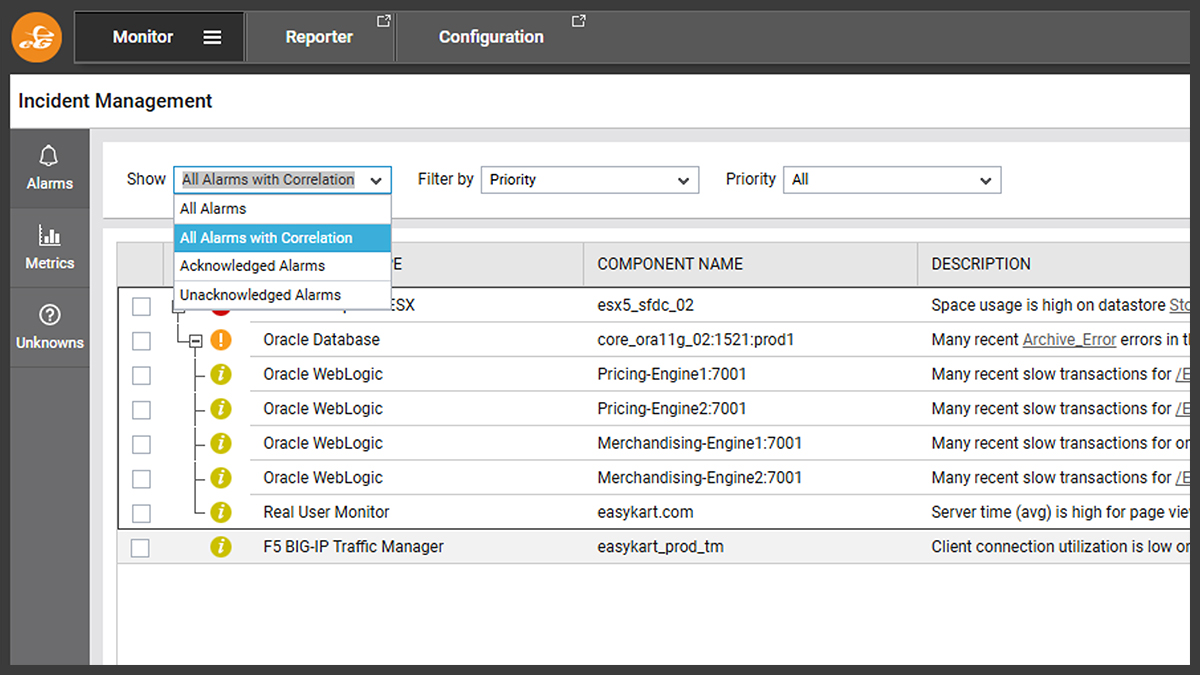
Once accessed, the “Incident Management Dashboard” allows alerts to be shown via number of filters including “with Correlation”.

This will show distinct event groups, in this case two distinct incidents, associated with incidence determined to have no correlation and likely to be unrelated.

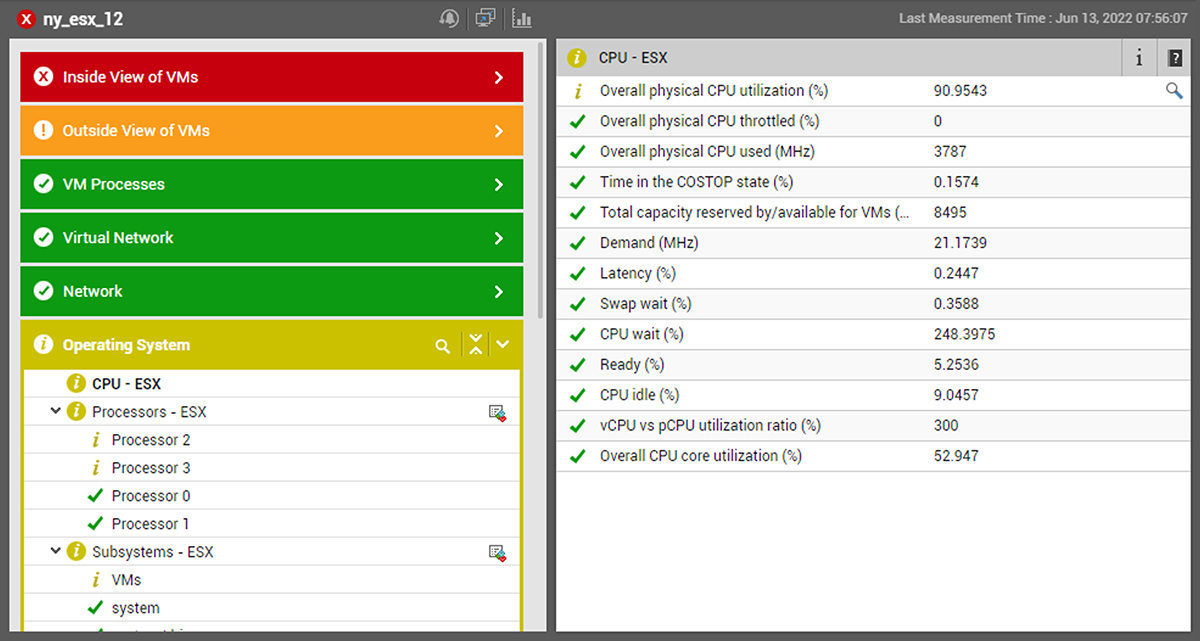
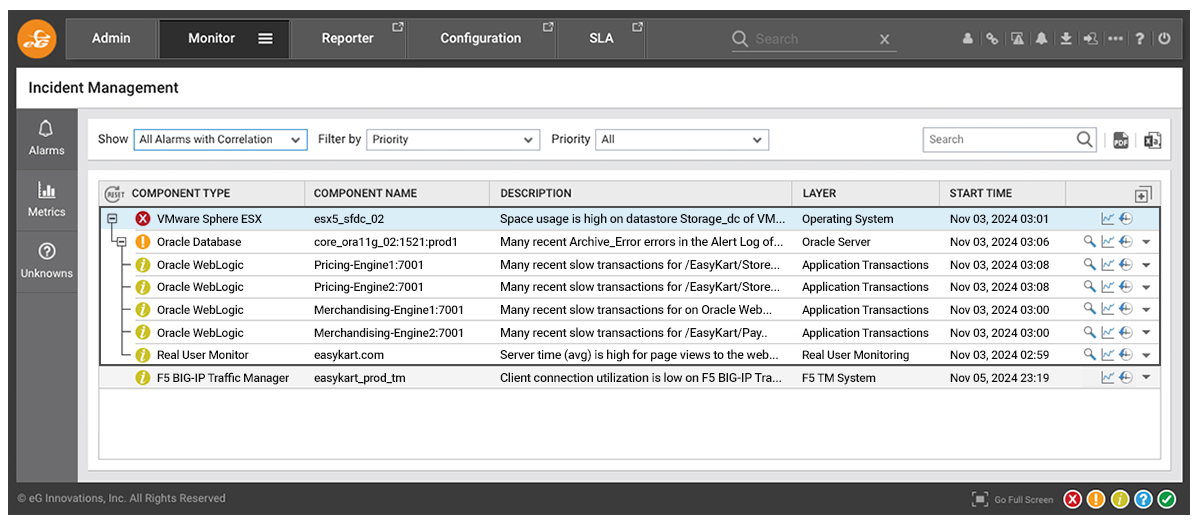
Expanding the event group associated with a VMware vSphere / ESXi suffering from storage space exhaustion, we see many secondary alerts. These alerts indicate that the storage problem has caused the database to have issues, which in turn has affected applications running on WebLogic servers reliant on the database, which has led to alerts in our RUM (Real User Monitor) because ultimately real users trying to use those applications are impacted.

Beyond grouping, eG Enterprise’s AIOps-powered intelligence has identified the hierarchy of causation to pin-point the root-cause. Helpful color-coding allows the administrator to clearly identify that the vSphere host’s storage issue is their top priority to resolve to protect the user experience and application performance.
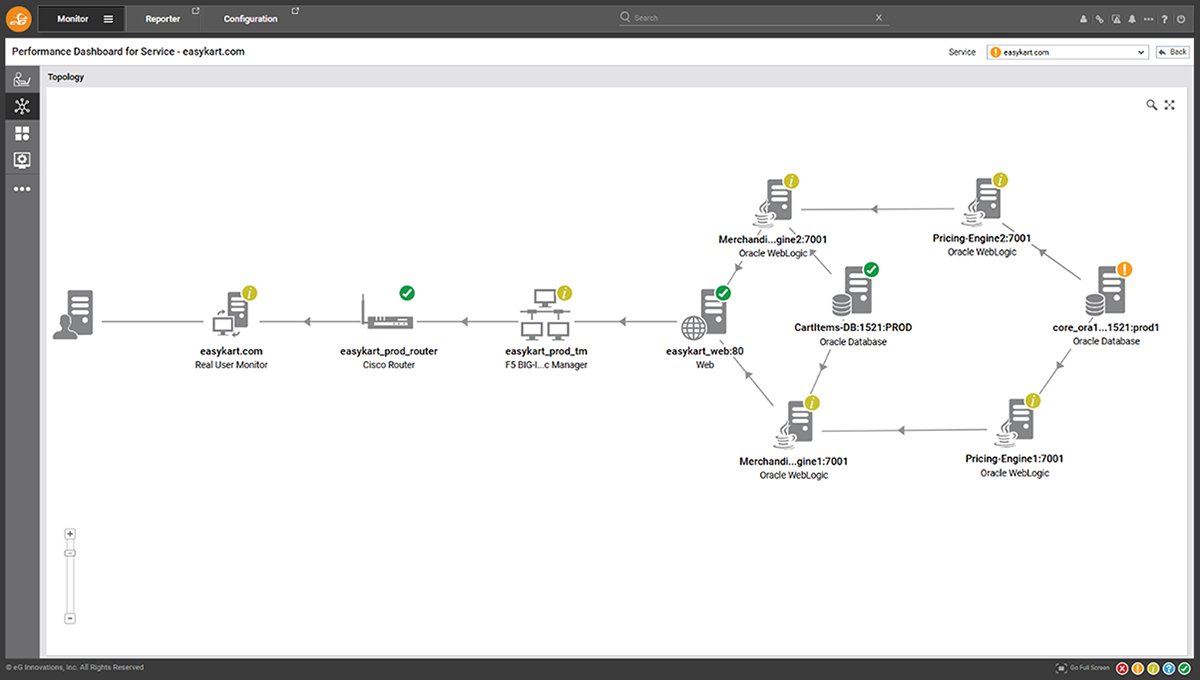
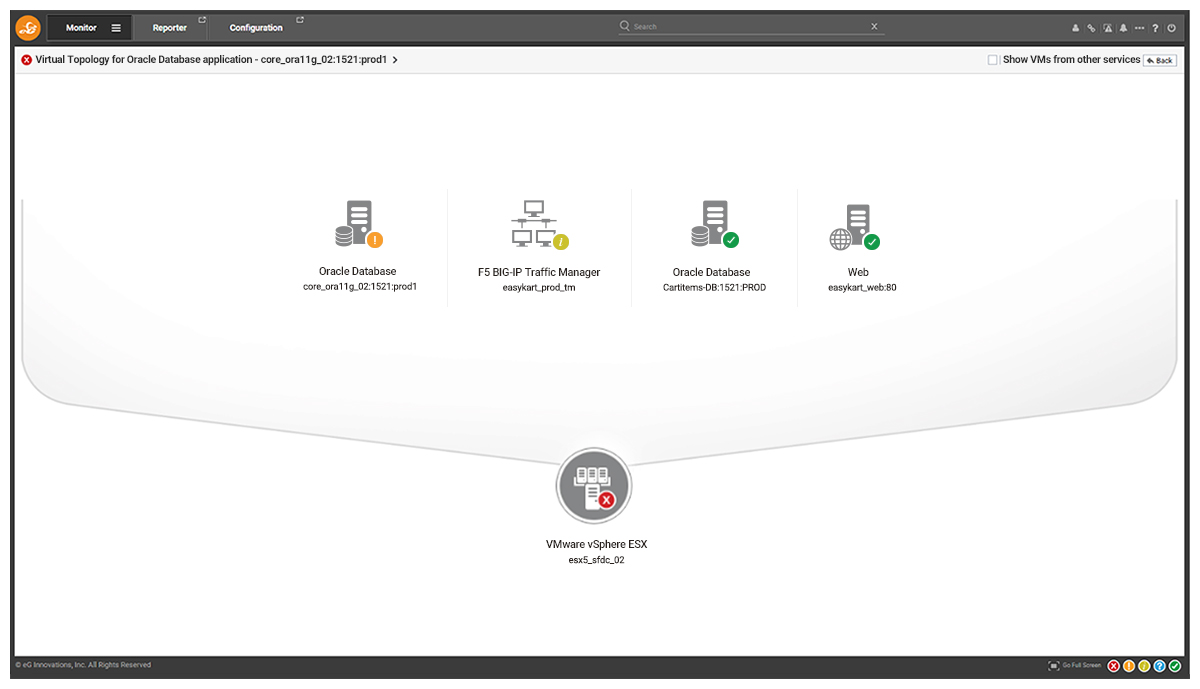
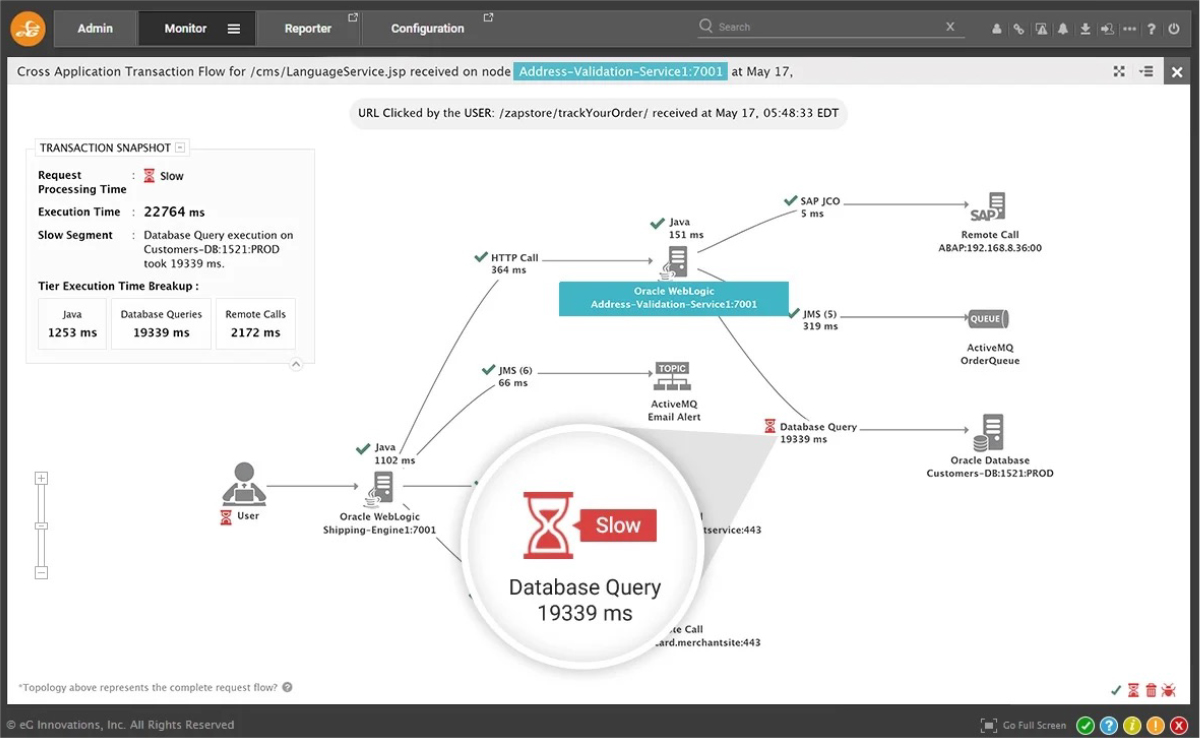
AIOps capabilities also enable eG Enterprise to build rich interactive topology maps of component dependencies. The alert correlation information is also overlaid on these to provide deep insights and understand of the root-cause analysis.


-
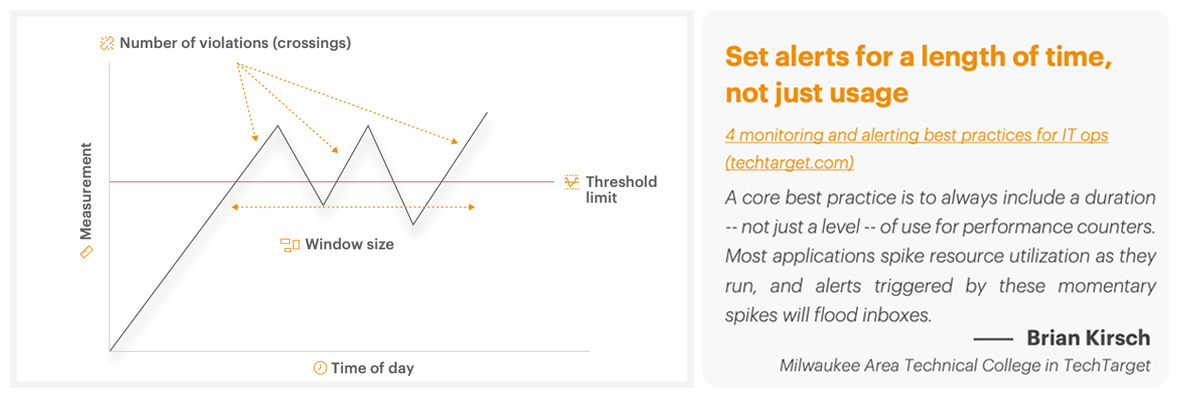
Deduplication and Noise Reduction: Event correlation reduces “alert noise” by eliminating redundant alerts or merging related alerts. For example, if an AVD host is using 100% of its CPU resources impacting many users, the secondary alerts associated with poor application performance and poor user experience can be deduplicated and handled as one collective issue. Event correlation can also filter out very ephemeral, transient events that alone are unlikely to be of interest to a system administrator – e.g. if a user’s endpoint experiences a 20 second spike in CPU usage while firing up an app this should not trigger alerts to help desk or administrators. The ability to combine both static and dynamic alert thresholds is a must in an AIOps-driven environment to minimize false alarms, see: Static vs Dynamic Alert Thresholds for Monitoring | eG Innovations- Successful event correlation relies fundamentally on the quality of the events and data ingested. In particular, a product’s capabilities to identify alerts from noise is extremely important – see: White Paper | Make IT Service Monitoring Simple & Proactive with AIOps Powered Intelligent Thresholding & Alerting.
 Figure 9: Intelligent event and alert correlation must include temporal awareness and concepts such as alarm/alert windows to avoid correlating noise
 -
Root Cause Analysis (RCA): A significant part of event correlation in AIOps is pinpointing the root cause of issues by identifying related events. For example, if several services go offline due to a database failure, the AIOps tool will correlate these events and identify the database as the root cause, allowing teams to focus on fixing that specific issue.

-
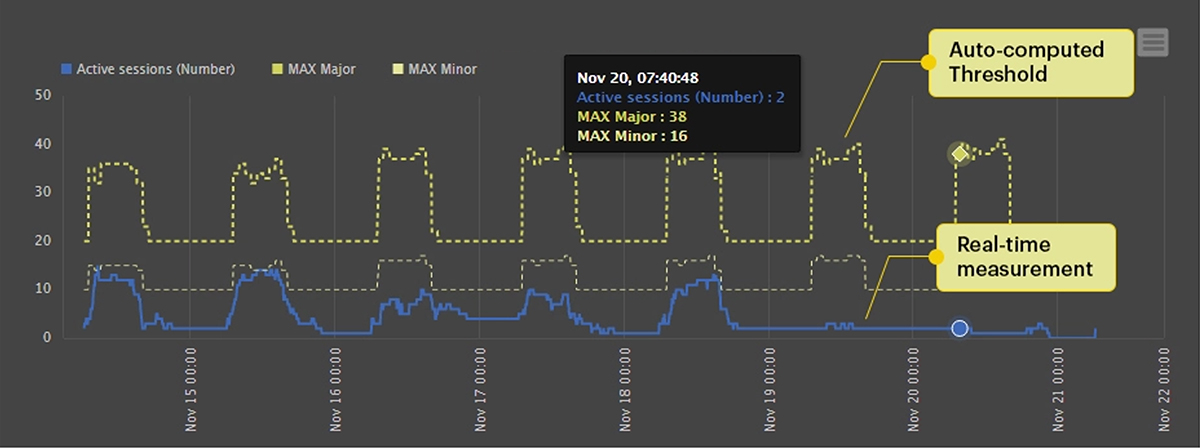
Anomaly Detection Using Automatic Baselines: AIOps tools use automatic baselining to define normal behavior across systems, taking into account historical patterns and usage trends. Using machine learning algorithms, the AIOps platform continuously observes data patterns and builds baselines that reflect regular, expected behaviors for different metrics across specific times of day, days of the week, or even seasonal variations. When a metric deviates significantly from the baseline, it signals an anomaly. This helps AIOps distinguish between routine activity and unusual patterns that may indicate problems. By comparing events against these baselines, AIOps tools can identify anomalies that correlate with other events, helping to identify the underlying cause of incidents even before they escalate.

-
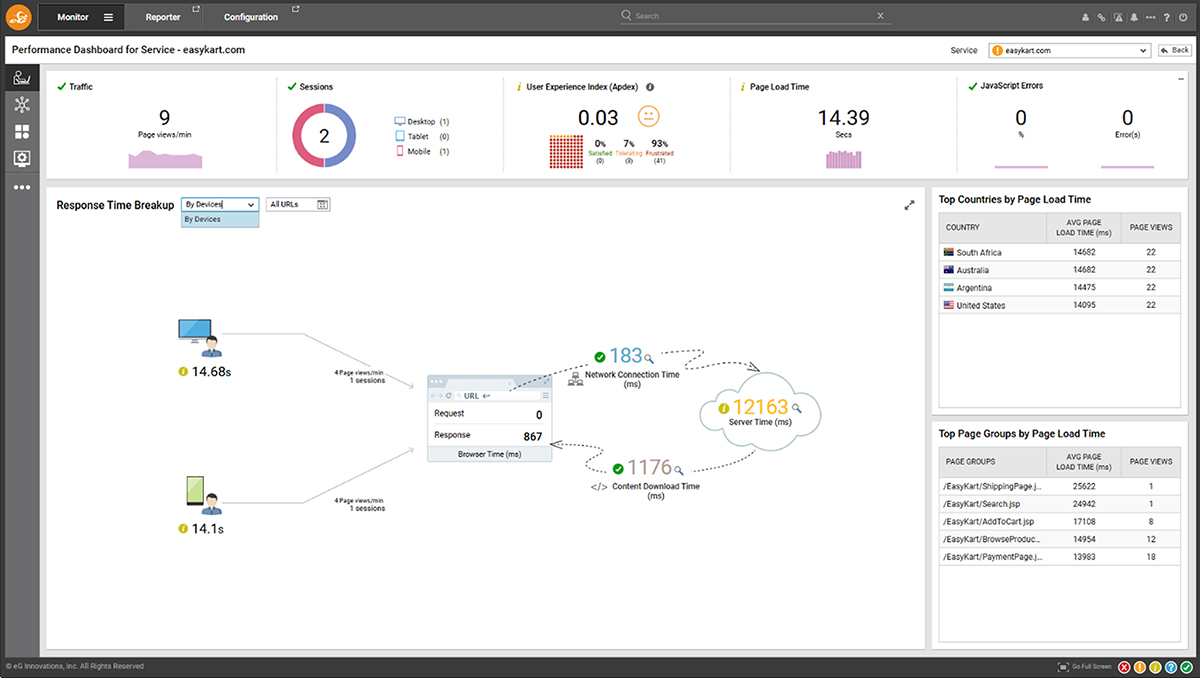
Impact Assessment: Event correlation in AIOps helps assess the impact of issues on users or business processes. For instance, by correlating events, an AIOps tool can detect if a network slowdown is affecting critical applications, which may require urgent attention.
Above, I described the event correlation associated with a serious storage issue on a VMware vSphere host that was impacting users. eG Enterprise was also monitoring the end user experience and web app performance of the applications dependent on the host.


- Automated Response and Remediation: Based on correlated events and root cause analytics, AIOps tools can trigger automated responses or remediation workflows, such as notifying relevant teams, opening tickets, or even initiating self-healing actions, such as restarting services, re-prioritizing processes or scaling resources. eG Enterprise offers numerous ways to automate remediation, from built-in domain-aware self-healing (e.g. for Citrix, see: Fixing Citrix Issues with eG Enterprise’s Automation | eG Innovations ), to rich APIs, and other built-in capabilities described in: Monitoring Automation & Scripting for Monitoring Systems. Read more on eG Enterprise’s monitoring automation on TechTarget, see: Auto-tech series: eG Enterprise – Automation for modern monitoring.

Benefits of Event Correlation in AIOps-powered Monitoring
 Reduces Alert Fatigue: By consolidating related alerts into a single incident, AIOps tools minimize the number of notifications, allowing IT teams to focus on critical issues without being overwhelmed by redundant alerts.
 Speeds Up Incident Resolution: With clearer insights into related events and root causes, IT teams can resolve incidents more quickly, reduce support tickets and minimize MTTR (Mean Time to Resolution).
 Improves Accuracy in Anomaly Detection: Automatic baselines enable AIOps tools to distinguish normal activity from true anomalies, reducing false alarms.
 Enhances Proactive Monitoring: By detecting early signs of potential problems through correlated events, AIOps tools enable IT teams to address issues before they escalate into larger incidents. Many confuse Synthetic Monitoring as proactive monitoring, see: What is Proactive Monitoring and Why it is Important for clarification.
 Supports Complex IT Environments: AIOps event correlation for monitoring is particularly valuable in modern, dynamic IT environments (such as microservices, cloud-native applications, and hybrid infrastructures) where interdependencies make it difficult to identify causes of incidents manually.
eG Innovations’ – A Proven Record with AIOps-powered Observability
 eG Innovations was one of the first adopters of AIOps technology, and some of our patents date back to 2012. This means we’ve had over a decade of experience leveraging AIOps for event correlation and root-cause analysis (see: eG Innovations Patents for Virtualization Performance Management).
You can read some of our historic articles on event correlation and monitoring, see:
- Event Correlation – Learn the Details of Event Correlation in IT
- What is Event Correlation, Analytics & AI | eG Innovations
- Event Correlation Techniques for Better IT Management
To learn more about event correlation, monitoring and observability and AIOps, please see:
eG Enterprise is an Observability solution for Modern IT. Monitor digital workspaces,
web applications, SaaS services, cloud and containers from a single pane of glass.
- White Paper | Make IT Service Monitoring Simple & Proactive with AIOps Powered Intelligent Thresholding & Alerting
- Demystifying AIOps: 8 Myths Dispelled for IT Ops Teams
- Observability vs Monitoring: What is the Difference?
eG Enterprise is an Observability solution for Modern IT. Monitor digital workspaces,
web applications, SaaS services, cloud and containers from a single pane of glass.
 Rachel has worked as developer, product manager and marketing manager at Cloud, EUC, application and hardware vendors such as Citrix, IBM, NVIDIA and Siemens PLM. Rachel now works on technical content and engineering and partner liaison for eG Enterprise