


Consider the scenario – You are an SRE (Site Reliability Engineer) joining a team to take charge of their Java applications. It has been reported that a Java application is very flaky in terms of memory issues and probably has a Java memory leak. You have a large cluster with many hundreds of JVMs (Java Virtual Machines) to monitor. Each time a memory incident happens, the conversations with the Application Development (AppDev) teams have gone on the lines of “not reproducible” or “works fine on my machine”.

Management recently moved to a cloud-based infrastructure and feel that the cloud and JVM will take care of all issues. How do you approach such a scenario? What myths are you likely to have to debunk? How do you justify the budget for the use of tools, automation, and changes in work practice to detect and resolve Java memory issues?
Here are some myths to be on the lookout for when it comes to Java memory leaks.
Myth #1: Java has automatic memory management, so there is no need to worry about memory leaks.

Reality: Memory leaks can still occur due to buggy application code that:
- Creates objects but does not de-reference them
- Holds on to static objects in HashMap or HashSet
- Does not close resources like JDBC (Java Database connectivity) connections, ResultSet, and Statement objects, file handles and sockets
- Keeps references to objects in ThreadLocal without cleaning them up
 Actions:

#1: Work with your upper management team to get budgets for production-like environments. Getting a replica environment up and running is usually simple on the cloud provided you have the right IaC (Infrastructure as Code) tools set up. A good replica environment will allow you to run realistic loads and get memory benchmarks. It has become industry best practice to set up memory usage benchmarks and chaos engineering tests on production-like environments.
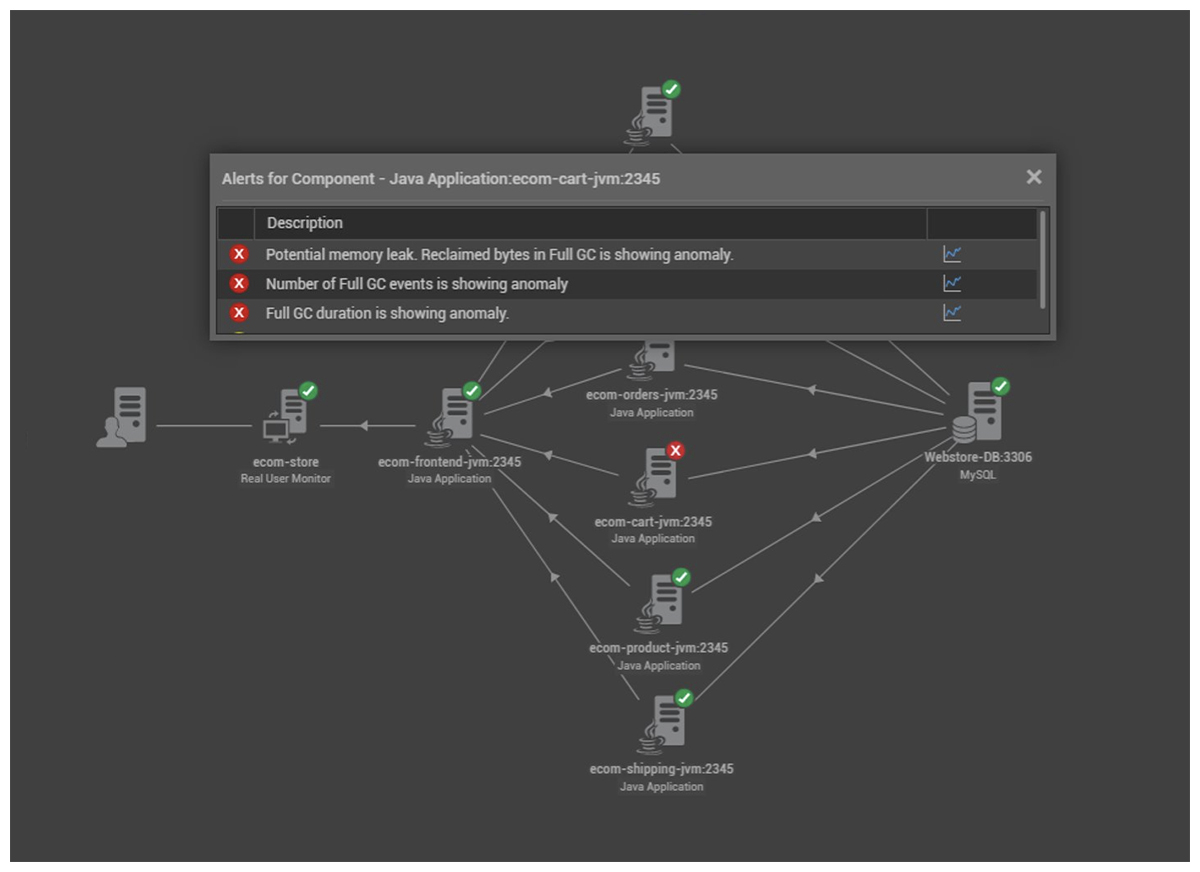
#2: Use automatic memory leak detection and JVM monitoring tools that give you early and proactive alerting on memory leaks. You can also use open-source tools (such as JVisualVM and MAT) but doing so across a Java cluster with hundreds of JVMs at non-regular hours (i.e., 2 am) will be cumbersome. Using heap dumps after the fact is reactive and too late in the game.
#3: Work with your AppDev team on chaos engineering and game days to simulate edge cases. Cloud services such as the Amazon AWS Fault Injector Service are now available to assist automating and integrating chaos workflows into standard development workflows. We have listed a few tools you may leverage to “kick the tyres” on your systems and applications, here: IT Infrastructure Management – Tools and Strategies (eginnovations.com). Formalizing chaos and “resilience testing” methodologies into development workflows can assist ISVs (Independent Software Vendors) and partners meet the criteria for formal partnership programs, compliance with major cloud providers frameworks such as the “Microsoft Well-Architected Framework for Azure” and can help those delivering services on cloud infrastructure gain credibility and confidence with customers and attract new business.

Myth #2: Memory leaks are only a concern for applications with a high level of traffic or usage
Reality: Memory leaks can also occur in applications with low levels of traffic or usage and can gradually grow over time.
With many businesses now running large numbers of microservices the cumulative effect of numerous inferior services and applications can collectively result in significant issues.
Actions:
#1 Soak tests can simulate long-term usage and uncover memory leaks. Running soak tests should be considered standard best practice. Some issues such as memory leaks do not become apparent until the system has been running for a while.
Often QA teams run load tests or stress tests but may have neglected to run soak tests (also known as endurance testing). While load testing is primarily concerned with performance assessment, and stress testing is concerned with system stability under extreme conditions, soak testing is concerned with reliability over a longer period of time. SREs often face the need to clarify the remit of test methodologies within an organization, articles such as Stress Testing, Soak Testing and Spike Testing Best Practices and Performance Testing vs. Load Testing vs. Stress Testing may assist conversations.
Top tip: If costs are a concern, you can run a low traffic scenario on spot instances or a medium instance on the cloud. Calibrate the load suitably to match the Java memory settings – Xmx and Xms, etc.
Myth #3: Our code is A+ grade quality. We can never have memory leaks
Reality: You could have written the best code, but your dependency libraries could have memory leaks.
Actions:
Get an inventory of dependent libraries for your application and test them for memory leaks.
#1: Make a full inventory of application dependencies. APM (Application Performance Monitoring) tools can help uncover hidden dependencies.
#2: Check if you have upgraded to the latest version and that you have processes in place to upgrade ongoing. This can be extremely important to ensure that your applications and services are secure and fully supported. Organizations that failed to schedule an upgrade from libraries with dependencies such as TLS 1.0 to TLS 1.2 faced security vulnerabilities beyond the issues of vendors such as Microsoft withdrawing support for applications dependent on legacy versions.
#3: Run soak tests that exercise the functionality of dependency libraries.
Myth #4: If we throw more memory at the application, it should take care of our problems
Reality: Throwing more memory is not the answer to a memory leak.
Memory leaks are like a bottomless pit – the more you throw in, the more it wants. You will eventually hit the upper limit of memory. You cannot predict when the application will hit the upper limit – when it does, your production service will suffer.
For example, you may have a memory leak in an important report. As more users access it concurrently, the system will eventually crash with an OutOfMemoryError.
If leveraging cloud infrastructure such as Google GCP (Google Cloud Platform), Microsoft Azure or Amazon AWS, resource based and PAYG (Pay As You Go) pricing means that unnecessary resources you use to mitigate memory leaks will impact your business’ profits and / or consume budget you could be spending on nicer things.
Actions:
#1 Use automatic memory leak detection and JVM monitoring tools that pinpoint leak suspects. These tools do the heavy lifting of sifting through detailed logs and monitoring metrics, using object histograms and heap dumps to identify the leak suspect.
#2 Understand the types of coding errors that cause memory leaks. There are plenty of good articles covering common coding errors and flaws, see: How to make Java run faster – 6 Tips | eG Innovations and Understanding Memory Leaks in Java | Baeldung. Use tools with code-level visibility to identify leaks and prove coding errors to developers, see what is possible in: Java Code Level Visibility | eG Innovations.
Myth #5: – If your application is the highest memory consumer, it has a memory leak!
Reality: Sometimes, applications could genuinely need a lot of memory, and this could cause a spike in heap usage. This does not necessarily mean that there is a memory leak.
Actions:
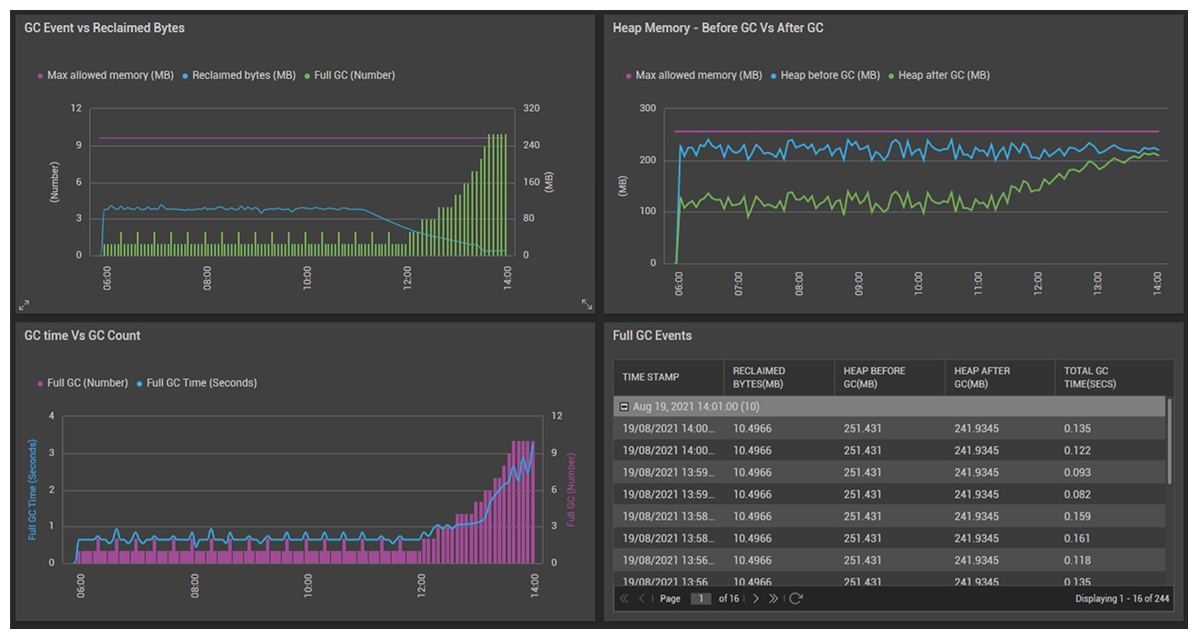
#1 Don’t play a guessing game with memory leaks, use monitoring tools. Examining the trend of your Java heap will help you determine if there is a memory leak. The application may naturally use a certain amount of memory, and the garbage collector will periodically reclaim memory at certain thresholds. You should see a rise and fall of heap usage with garbage collection.
#2 Evaluate those monitoring tools thoroughly. Good automatic memory leak detection and JVM monitoring tools use automatic baselining patterns and AIOps (Artificial Intelligence for Operations) / machine learning techniques to distinguish between inadequate or insufficient memory resource allocation vs a memory leak. Eliminate the guessing game.
#3 Question high memory usage or runtimes of third-party applications. There is a huge amount of flaky code out there that whilst it does not actually leak memory, simply is not optimized. Understanding types of coding flaws and optimizations that impact applications can help you recognize the symptoms if they impact your IT operations team. If an application’s resource usage seems excessive raise questions with the vendor / supplier.
Good APM tools can often help you reverse engineer third-party applications and gather data to support your suspicions to help raise requests for improvements from third-party vendors.

Myth #6: Restarting the Application or Server will Fix Memory Leaks
Reality: It is quite common for ITOps teams to put in quick fixes such as restarting applications or servers. Restarting the application itself will not necessarily release any memory inappropriately allocated and often only frees that memory allocated correctly that could be cleaned up by regular garbage collection, the freeing of that memory might buy you a bit of time, but the problem will reoccur.
Rebooting application servers or physical servers will reset the memory but long-term, any issues leading to memory leaks will reoccur, often more frequently. Needing to reboot servers regularly is an indication of application issues and that your applications may be consuming resources unnecessarily and exposed to performance issues and slowdowns. Ignoring indicators of application issues is unwise.
Actions:
#1 Proactively identify frequent server reboots and consider monitoring Server Uptime beyond Server Availability. The article, What is Server Uptime Monitoring? (eginnovations.com) helps explain the differences. eG Enterprise’s extensive auditing capabilities ensure that you will be able to trace who or what triggered reboots see: Auditing Capabilities in IT Monitoring Tools | eG Innovations. The fix history capabilities also provide administrators with the capacity to record and document the reasons and history when a decision to reboot is taken.
#2 Train and educate staff to avoid bad-practices and quick fixes if possible. Put in workflows and tooling to ensure that if steps like server reboots are used (to get users working again quickly), those incidents can be retrospectively analyzed to address the true root-cause later.
Myth #7: Memory Leaks Only Happen in Older Versions of Java
Reality: Memory leaks can happen in any version of Java, including the latest version. In fact, new features and improvements in Java can sometimes introduce new sources of memory leaks. For example, there were memory leaks associated with the C2 JIT Compiler in Java 11.0.16 that impacted applications such as Jenkins. Note: Errors in compilers can be a source of memory leaks even when the original source code has no errors.
Actions:
#1 SREs should be aware of Java version and compiler changes and make sure they are familiar with any known new sources of memory leaks.
#2 When new versions of languages such as Java and compiler tools are released it is best practice to avoid any other changes so regressive behavior can be easily identified a linked to the version changes. Avoid infrastructure, operating system, and application code changes where possible – this can be challenging if relying on public Cloud type infrastructure.
Takeaway Thought
As an SRE it is important for you to work with non-technical stakeholders and educate them about the realities of JVM and memory management. Raising awareness and addressing misconceptions can help you prove your value to a budget and long-term help you justify budgets and resources such as hardware, staffing and good monitoring and diagnostic tools.
If you set up the right tools to accurately diagnose and fix memory leaks, you can minimize Mean Time To Resolution (MTTR) and avoid putting business SLAs (Service Level Agreements) at risk.
eG Enterprise is an Observability solution for Modern IT. Monitor digital workspaces,
web applications, SaaS services, cloud and containers from a single pane of glass.
Related Information
If you enjoyed this article or found it useful to use to explain the role of an SRE, you might like to explore these:
eG Enterprise is an Observability solution for Modern IT. Monitor digital workspaces,
web applications, SaaS services, cloud and containers from a single pane of glass.
- What is Java Garbage Collection
- An overview of eG Enterprise’s Java support Java Monitoring – Java Application Troubleshooting Tool (eginnovations.com), links to .NET, PHP and Node.js coverage are accessible via this link too
- Top Java Performance Problems & How to Fix them
- How to Simplify Java Monitoring and Get Code-Level Visibility (eginnovations.com)
 Arun is Head of Products, Container & Cloud Performance Monitoring at eG Innovations. Over a 20+ year career, Arun has worked in roles including development, architecture and ops across multiple verticals such as banking, e-commerce and telco. An early adopter of APM products since the mid 2000s, his focus has predominantly been on performance tuning and monitoring of large-scale distributed applications.

