In an earlier blog post, we had discussed how server performance monitoring is not just about monitoring CPU, memory, and disk resources anymore. There is more to server performance monitoring than just three resources or metrics. That blog post covered several key performance indicators (KPIs) that IT teams must track to ensure that their servers are performing well. In this blog post, we focus on another KPI – server uptime.
What is Server Uptime?
Current uptime of a server is measured as the amount of time that the server has been up and running since the last time it rebooted. Uptime is expressed in years, months, days, hours, minutes, and seconds. Every time the server reboots, up time is reset to 0 (zero) and starts increasing as the server remains up and operational.

On Unix systems, up time is measured using the “uptime” command. On Windows, up time is reported on the Performance tab of the Task Manager. Check the “CPU” setting.
Sometimes, uptime is indicated as a percentage. Uptime, as a percentage, is computed as the time that the server has been operational, divided by the total measurement period. For high reliability, up time should be close to 100%. A value below 100% indicates that the server has been rebooted during the measurement period.
Server Uptime Monitoring with eG Enterprise
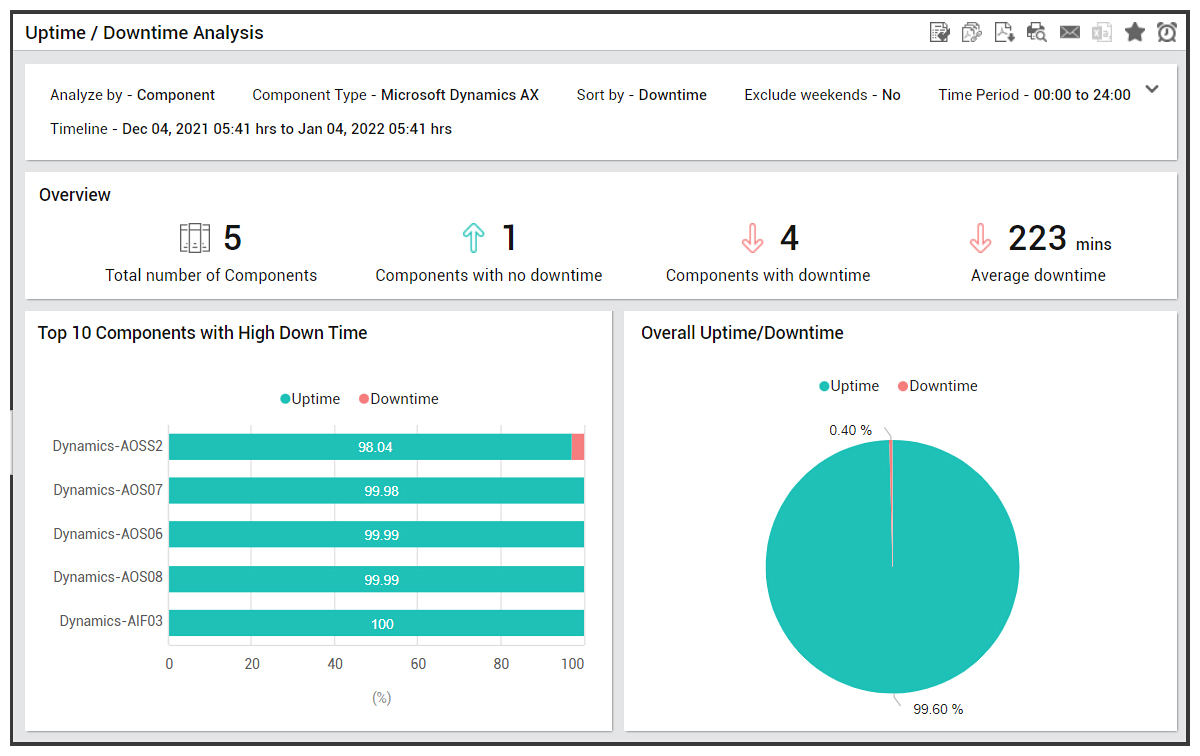
eG Enterprise agents on servers track the uptime of the server. At preset regular intervals, the up time of the server over the measurement interval is captured. For example, the figure on the top right shows what eG Enterprise reports. It checks every 5 mins. If the server has rebooted in 5 mins, eG Enterprise’s report will show that and if it has, it will also report the time it is up out of those 5 mins. The overall up time of the server is also reported.

Server reboots are detected and uptime of the server during that measurement period is indicated.

This information is then used to report on the percentage of up time of any server, for any period.
 Uptime and Availability are Not the Same
Uptime and availability are often used interchangeably but they are not the same:
- Uptime is the amount of time a server is up and operational. It is usually an internal measure of the server – i.e., it is reported by the server itself.
- Availability is the percentage of time, in a specific time interval, during which a server is available for its intended purpose. For example, network availability of a server can be measured by pinging the server.
Availability is usually an external check, unlike up time, which is an internal check.
Uptime Doesn’t Just Apply for Servers
Uptime is also important to track for network devices. The sysUpTime OID in the MIB-II specification – see https://oidref.com/1.3.6.1.2.1.1.3 – provides the uptime of any device. As with servers, eG Enterprise also reports uptime for any network device it monitors.
Uptime is also relevant for applications. For example, a server may be up but a Java application running on it could be down. Where applications support eCommerce sites and services, it is the application and service uptime that reflects the key business availability not the uptime of the underlying infrastructure. eG Enterprise also tracks uptime of applications.
Uptime of virtual platforms, such as VMware ESXi or Citrix Hypervisor servers is a critical measure to track. If a VMware ESX server reboots unintentionally, all the VMs running on it will be impacted along with the users and applications those VMs support.
There is no standard command or API to track uptime for any application or virtual platform, which is why eG Enterprise uses APIs supported by the target application/server. Uptime for ESX servers, web servers, Java applications, database servers, etc. are tracked this way. To enable such an analysis for critical virtual servers on a NetScaler (ADC) appliance in an IT infrastructure, eG Enterprise provides the NetScaler-Virtual Server Up-time report.
Why is Uptime Monitoring Important?
Many organizations may have criteria indicating how frequently their servers, devices, and applications must be rebooted/restarted. A reboot/restart clears memory of the server, device, or application and may therefore, help improve its performance. Administrators can set alerts on the absolute uptime value of any server, device, or application and be alerted when the uptime exceeds a pre-specified period of time. A comparison of uptime values across systems also highlights the ones that have not been reset in a long while.
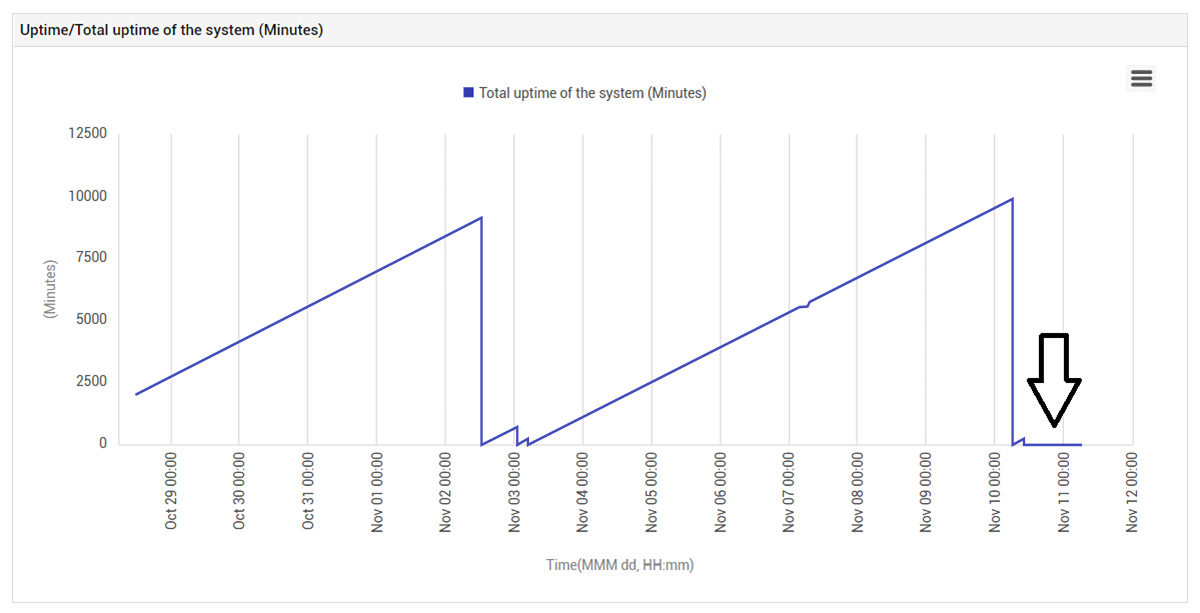
Monitoring of uptime can reveal the occurrence of unintended reboots. For web servers, database servers, etc. where users directly access these servers and applications, downtime is usually detected by users and reported to the helpdesk. For other systems – e.g., routers, switches, or infrastructure servers like DNS and Active Directory, users may not directly detect and report such issues. So, frequent reboots of these systems may go undetected. Below is an example we encountered at one of our client sites recently. Figure 4 below shows that there were a number of server reboot events that occurred.
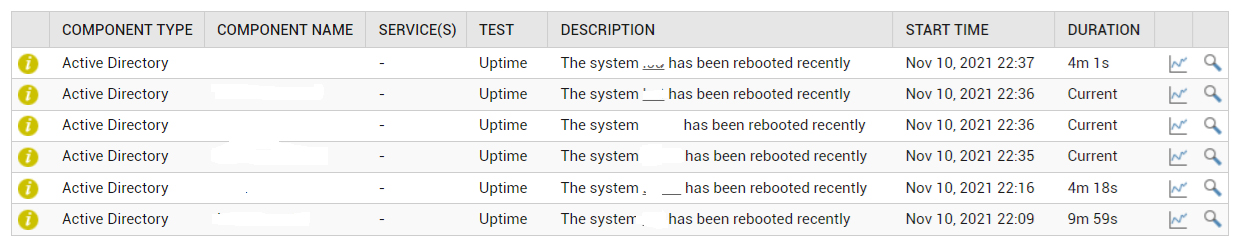
Detailed analysis of server uptime indicated that starting on Nov 10, 2021, the server had a very low up time. That is, all of a sudden, what had happened was that the server suddenly started rebooting every few minutes, resulting in low up time. This problem had not been raised by users and the client’s helpdesk team was unaware of the issue.
Analysis of the server’s event log showed the reason for the reboot:
| Event[98] | |
| Log Name | System |
| Source | User32 |
| Date | 2021-11-10T21:12:56.038 |
| Event ID | 1074 |
| Task | N/A |
| Level | Information |
| Opcode | N/A |
| Keyword | Classic |
| User | S-1-5-18 |
| User Name | NT AUTHORITY\SYSTEM |
| Computer | _____ |
| Description | The process wininit.exe has initiated the restart of computer ____ on behalf of user for the following reason: No title for this reason could be found |
| Reason Code | 0x50006 |
| Shutdown Type | restart |
| Comment | The system process ‘C:\Windows\system32\lsass.exe’ terminated unexpectedly with status code -1073741819. The system will now shut down and restart. |
The issue was resolved by following the steps indicated in this link – Server 2019 Event ID 1074, Reason Code: 0x50006 Lsass.exe terminated unexpectedly.
Conclusion
The real-world example described in this blog highlights a scenario where up time monitoring helped identify and resolve unintentional reboots of systems. If IT teams have to detect performance issues proactively, before users call and complain, it is important that they monitor uptime for every server, application, or device that they are responsible for. By tracking up time, IT teams can learn when systems are going down unintentionally, or even if some systems are not going down as they should as part of periodically scheduled maintenance reboots.

eG Enterprise is an Observability solution for Modern IT. Monitor digital workspaces,
web applications, SaaS services, cloud and containers from a single pane of glass.