

Java is one of the most widely used platforms for supporting web applications. According to RedMonk and TIOBE rankings, Java has consistently remained in the top 4 most popular programming languages worldwide, with millions of developers actively using it. Industry-standard application servers such as WebLogic, WebSphere, Tomcat, and JBoss all run on Java and power a large share of enterprise workloads and Java web applications.
When you deploy a Java web application, a key decision is the choice of operating system. While Java is platform-independent, the underlying OS still influences performance, scalability, and manageability. Very often, the choice of OS comes down to what technologies the admin team is most comfortable with. In many enterprises and use cases, Windows dominates—as of 2024, Windows Server still accounts for nearly 72% of enterprise server deployments—while Linux adoption continues to grow rapidly (source: Linux Statistics 2025 – TrueList), especially in cloud and container-native environments. However, Linux can be a challenge for those admins who may be more familiar with GUI-based administration in Windows.
In this blog, we will highlight key performance and operational differences between Windows and Linux for supporting Java web applications today. Our analysis is based on a real-world case of troubleshooting a malfunctioning Java web application at a large global enterprise.
Java Web Application Deployment
We were tasked with optimizing performance and troubleshooting sporadic issues that occurred with a multi-tier web application. Apache Tomcat 10.1 was the web application server and Microsoft SQL 2019 was the database server in use. Both the application server and the database were on dedicated systems running Microsoft Windows Server OS 2019. JDK 17 was the version of Java in use. As the application was accessed by 1000s of remote clients, a redundant cluster of application server and database server pairs was in use. While application performance overall was acceptable, we noticed that every few days some of the application logic failed and there were also synchronization errors between the application servers.
Troubleshooting Performance Issues: Trial and Error
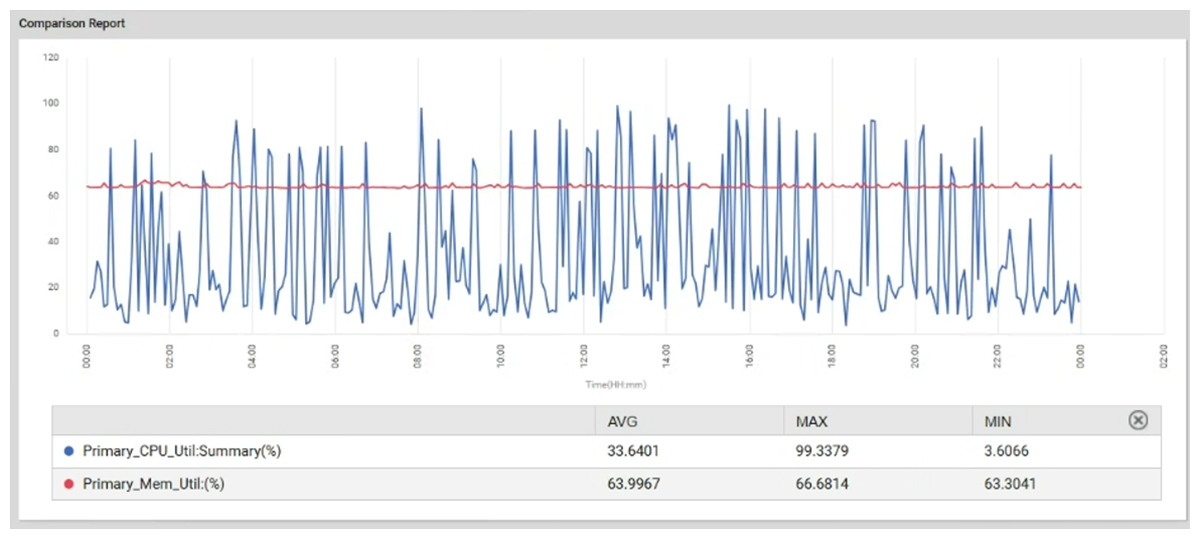
The first thing we did was benchmark the system performance of the application server and database. We did not see a large number of connections to the database server and all the key SQL parameters were normal, indicating that there was no bottleneck in the database tier. On the Tomcat application server also, there were no resource bottlenecks (see Figure 1).
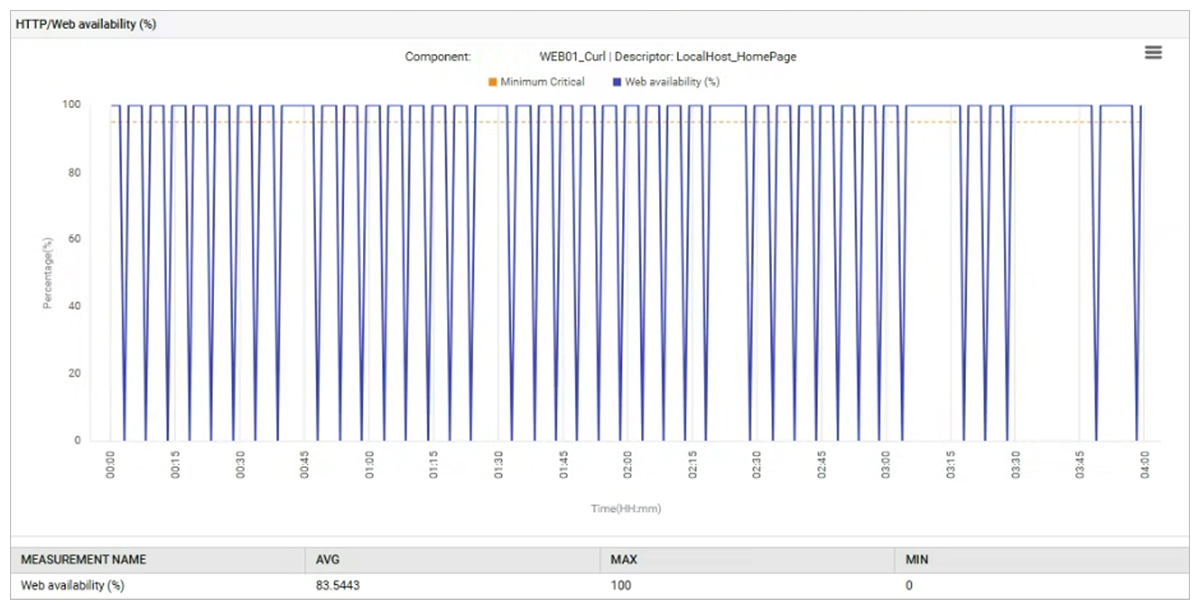
Synthetic application checks configured to run throughout the day every 5 minutes showed availability failures at several times during the day. Analyzing the failures, we could see “Connection Refused” messages on the client – indicating that the server refused to accept connection requests from the client. To isolate whether the issue was network related or not, we configured the synthetic checks to run from within the server itself. These checks targeted the local address of the server and therefore, would not involve any network communication. Even after this change, we observed availability failures (see Figure 2).
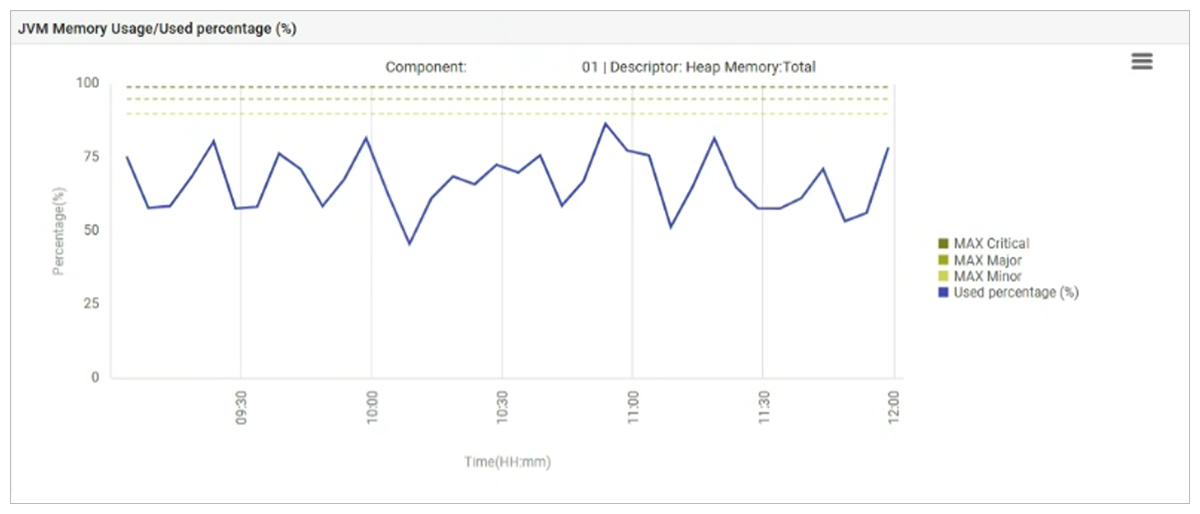
We then configured the availability checks to target a different port on the application server (one that was not used by the clients). When a dedicated port was used for the synthetic checks, we did not find any availability errors. If the application had been the cause of the bottleneck, we would have seen availability errors even with a dedicated port being used for the synthetic checks. Analysis of the Java web application’s CPU and heap memory usage (see Figure 3) showed no bottlenecks, as expected.
 | The fact that there were connection drops seen for connections made internal to the server pointed to an issue in the server, rather than somewhere in the network. |
Our analysis indicated that the server OS was a bottleneck. However, a review of the key server resources (CPU, memory, disk, network) did not reveal any issues. We even doubled the capacity of the system – by doubling the CPU and memory configured – and that did not stop the application issues from occurring.
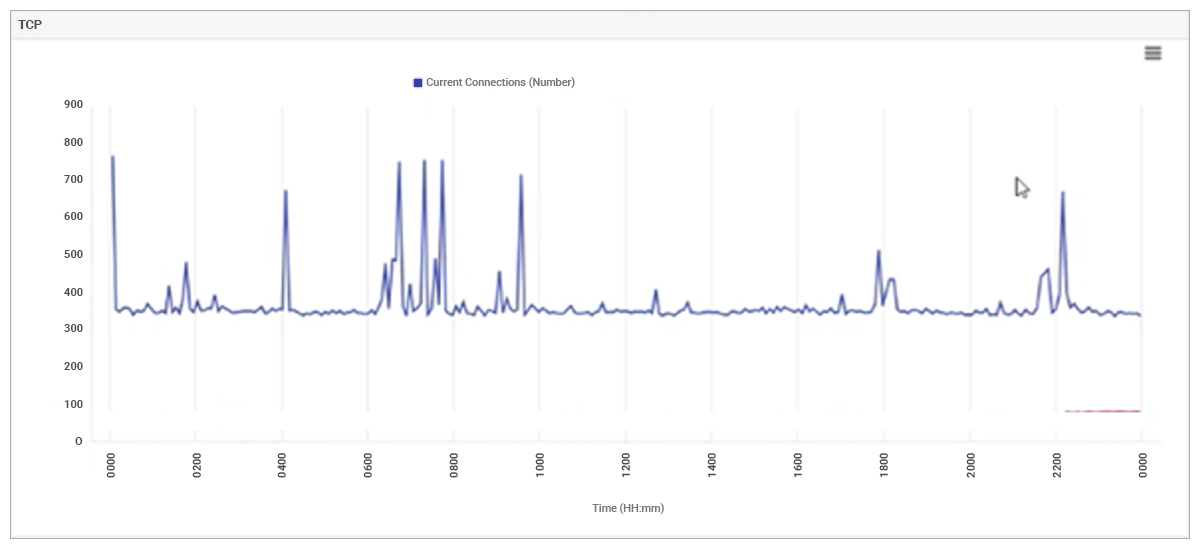
A common reason for connection refused errors is over utilization of ephemeral TCP ports on a server. Analysis of TCP connections in different stages indicated that at no time was the server seeing more than 3000 connections in different states, with less than 400 TCP connections established at most times (see Figure 4), whereas the total limit of ephemeral ports was configured to 49000. Hence, the server was not reaching the TCP ephemeral ports limit either. Yet connections were being refused periodically.
What are TCP Ephemeral Ports?
 A TCP ephemeral port is a temporary, automatically assigned port number that a client machine uses to establish a connection with a server. Unlike well-known server ports (like 80 for HTTP), ephemeral ports are dynamic, short-lived, and used only for the duration of a single communication session, after which they become available for reuse. These ports are essential for enabling client-to-server communication by providing a unique, temporary endpoint for each outgoing connection, preventing conflicts and allowing for multiple simultaneous connections.
We proceeded to disable all the security software on the system, but the application connection availability errors continued.
Further application and OS tuning was attempted:
- Tomcat’s heap memory was increased with no effect.
- Tomcat’s accept queue is often seen as a bottleneck. We increased the acceptCount of Tomcat several times – to 10,000+ connections to no avail.
- We changed a number of Windows registry entries relating to TCP connections (in HKEY_LOCAL_MACHINE\SYSTEM\CurrentControlSet\Services\Tcpip\Parameters) including TcpNumConnections, TcpTimedWaitDelay and SynAttackProtect values (see https://learn.microsoft.com/en-us/answers/questions/495615/how-to-set-to-allow-maximumtcp-connection-in-windo) but this did not help.
The evidence though still indicated that the problem was related to TCP connection handling on the server.
Narrowing Down the Cause of the Problem
To narrow down the cause of the problem, we simulated a similar environment. We created a client utility that created a given number of simultaneous TCP connections using multiple parallel threads. During our testing, we noticed if there were 200 connections or less, there were no connection refused errors. When the number of simultaneous connections attempted increased beyond 200, we saw some connection refused errors. As the number of connections increased, so did the errors. It turns out the limit of 200 connections is imposed by the Windows OS (Windows server OS has a limit of 200, client OS has a limit of 5 – see https://docs.sockettools.com/v11/activex/tcpsrv/control/property/backlog.html).
What is the TCP backlog queue?
When a client initiates a TCP connection to a server, the server’s TCP layer places the connection request in the backlog queue.
Max backlog queue length is the maximum number of pending TCP connection requests that the operating system will queue for a server application before it starts rejecting new connection attempts. This backlog queue is used to manage incoming connection requests while the server is busy processing other connections.
The Windows OS provides a way for applications to provide it a hint to set the maximum size of the backlog queue – see https://blogs.msdn.microsoft.com/winsdk/2015/06/01/winsocks-listen-backlog-offers-more-flexibility-in-windows-8 and https://learn.microsoft.com/en-us/windows/win32/api/winsock2/nf-winsock2-listen.
Analyzing this further, we came across a recent Java bug relating to TCP connection handling. See RFR: 8330940: Impossible to create a socket backlog greater than 200 on Windows 8+. When a Java program listens on a TCP port, it can provide a backlog queue length to the listen call. On Windows, when an application provides a larger backlog queue in the Socket listen call, Java ignores this – therein lies the bug. So, if at any time, more than 200 connections are in the half open stage (between SYN start and connection establishment), the Windows OS will refuse these connections. Clients see errors when this happens.
Why is this Important?
Many client applications are designed assuming connections to remote applications will work – i.e., without a failover mechanism. Such applications will see abnormal behavior when TCP connections are refused and the application logic may fail (e.g., a regularly scheduled compliance report may not be created and saved, two applications may be out of sync, resulting in inconsistencies, etc.). Furthermore, in this situation, an application is not completely unavailable – some connections will succeed and others might fail. To handle such situations, review your Java web application code and ensure that you have failover/retry mechanisms in place to gracefully handle situations when TCP connections are refused by the remote server.
The fact that even when a server is lightly loaded, TCP connections can be refused by the server is confusing. Java/JDK 26 in an early release fixes the issue – see OpenJDK JDK 26 Early-Access Builds. This fix is not available in any other versions of Java at this time.

Linux vs. Windows OS for Java Web Applications
We have tested the same application with Apache Tomcat running on Linux OS and a similar load. The default TCP backlog queue length on Linux is 4096. Furthermore, Java on Linux currently handles the TCP backlog queue more efficiently than it does on Windows. Even when there are over 3000+ simultaneous connections incoming to the server, Apache Tomcat on Linux does not refuse any incoming connections. This results in significantly improved performance. Hence, until Java 26 is generally available, you could consider deploying your Java application servers on Linux OS to avoid the performance issues we encountered.
Lessons Learned
- If you have Java web applications handling high load, Linux is the preferred platform currently.
- Ensure that you have end-to-end monitoring in place to get complete visibility into your application’s performance. Ruling out which areas or tiers are not bottlenecks is important in the triage process.
- Even with monitoring in place, you may need to be innovative and reconfigure some of the health checks to narrow down what the cause of the problem is.
- Applications need to be designed with retry mechanisms in place, otherwise sporadic communication failures can lead to unexpected user experience issues.
eG Enterprise is an Observability solution for Modern IT. Monitor digital workspaces,
web applications, SaaS services, cloud and containers from a single pane of glass.
For further reading:
You may like to read some third-party articles around TCP connections, see:
eG Enterprise is an Observability solution for Modern IT. Monitor digital workspaces,
web applications, SaaS services, cloud and containers from a single pane of glass.
 Pandian Ramaiah is a Technical Consultant based in the eG Innovations’ Singapore office. He works with customers across the APAC region providing technical advice and solution architectures to implement modern observability across a wide range of technologies including APM, infrastructure and databases.

