Taking an application-centric approach to monitoring EUC technologies is essential to ensuring success and optimal DEX (Digital Employee Experience) when delivering desktops and apps via VDI / DaaS or from the Cloud.
The EUC (End User Computing) community in recent years has increasingly focused on user experience and DEX (Digital Employee Experience) as key measures of success. Any EUC service ultimately needs to ensure users are satisfied and can work productively. For end-users, their requirements can be distilled into the single need – access to the specific applications they need to do their job, and for those apps to be performant and reliably available.
No matter how performant the DaaS or VDI platform and desktops are if the application a user needs to use crashes, is unavailable or is slow the user will not be satisfied.
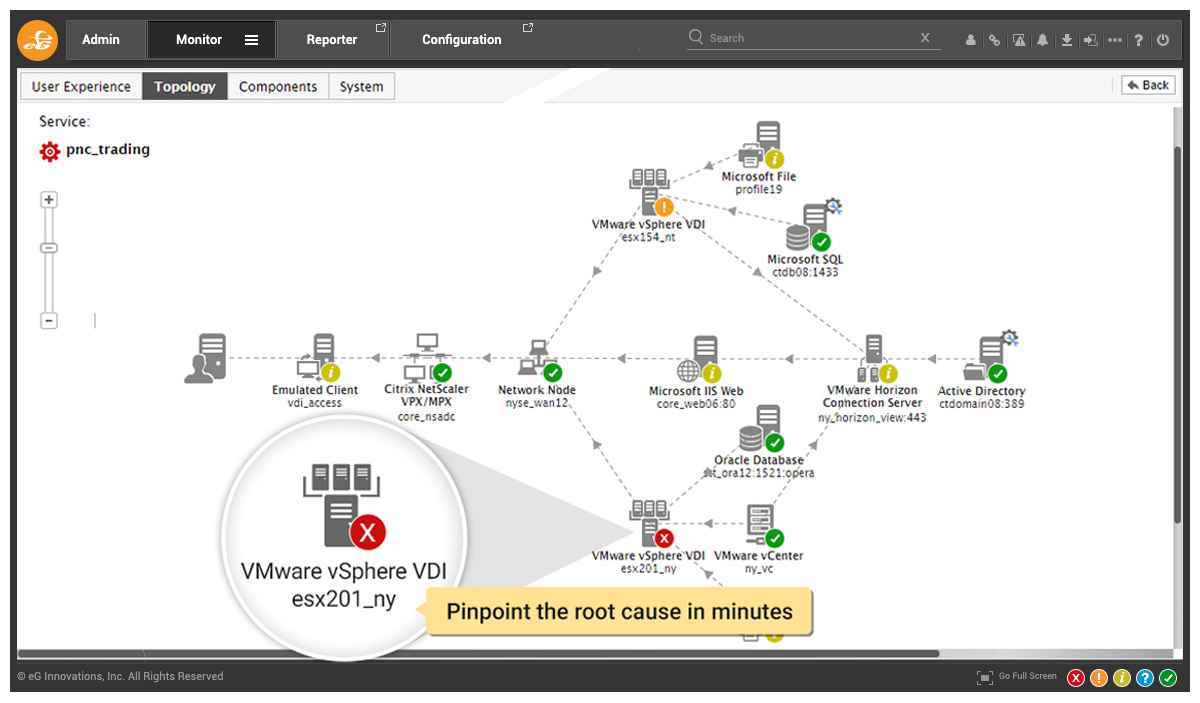
An Application-Centric approach to EUC monitoring focuses on the ability to see all your application tiers in a single view, and then drill down to different tiers and evaluate each tier’s performance including down to code-level visibility.
Application-centric monitoring vs. Infrastructure and platform monitoring
Historically many EUC deployments have focused on the delivery of platform and infrastructure. In many organizations there is an EUC team, for example, tasked with delivering Citrix Desktops. The applications published within those desktops are often the responsibility of a different team or third-party vendor and increasingly may be sourced as SaaS. This is especially true in the MSP (Managed Service Provider) markets where organizations outsource the provision of desktops to MSPs, and the organization then brings their own applications.
Our recent healthcare case study with MSP services provider Spadafy highlights this continual challenge for the EUC administrator where application issues often involve “Proving it isn’t the VDI”, read more: Spadafy leverages eG Enterprise to deliver secure VDI and professional services to healthcare providers (eginnovations.com).
How to take an application-centric approach to EUC monitoring – 5 Basic steps
Step 1: Define Key User Applications
 Start by identifying the critical applications that are essential for your users. Understand their importance to business operations and their impact on user productivity. By prioritizing these key applications, you can focus your monitoring efforts on the areas that have the most significant impact on end-user experience and employee productivity. Some enterprise monitoring tools also offer EAM (Enterprise Application Monitoring) with support for widely used critical applications such as: Microsoft apps and Office 365 / Microsoft 365 on-prem and in cloud – MS Teams, Word, Outlook, SharePoint etc., SAP, Moodle, PeopleSoft and so on.
Monitoring real user application usage means you can rationalize licenses and save money but also avoid supporting unused applications unnecessarily reducing general maintenance.
Step 2: Monitor User Experience Metrics
 To gain insights into the end-user experience, monitor key performance indicators (KPIs) that reflect user satisfaction. Metrics such as application response time, login duration, session latency, and screen refresh rates provide valuable data for assessing the EUC experience. Leverage specialized monitoring tools or VDI management platforms that can collect and analyze these metrics in real-time. Support for protocol metrics is very important as what may appear to be an application shuddering / hanging or feeling unresponsive to mouse movements is often the manifestation of protocol problems often associated with networking or server resources.
Step 3: Establish Baselines and Thresholds
 Create baselines for the identified user experience metrics by collecting data over a defined period. Analyze the patterns and establish performance thresholds that indicate acceptable and unacceptable performance levels. These thresholds will serve as benchmarks for evaluating the health and performance of your VDI system. When a metric breaches a threshold, it should trigger alerts, enabling proactive identification and resolution of issues before they impact end-users. With eG Enterprise’s built-in AIOps technologies automated dynamic baselines are combined with domain specific industry thresholds to provide proactive alerting out-of-the-box with no need to manually analyze data or manually configure thresholds and alerts.
Step 4: Monitor All Application Dependencies
 Many applications rely on various underlying components such as cloud instances, databases, web servers, IIS (Internet Information Server) or external services. Monitor these dependencies to identify potential bottlenecks or performance issues. By understanding how these components impact application performance, you can address any issues promptly and ensure a smooth end-user experience. Look for EUC tools that also support monitoring all dependencies.
It is extremely common for EUC users to encounter applications that are sluggish or fail as a result of slow database operations and often database monitoring is an area EUC admins have restricted visibility for with legacy EUC monitoring tools. You can learn more about eG Enterprise’s Database monitoring capabilities, here: Database Monitoring Tools | eG Innovations.
Step 5: Leverage End-User Feedback and Track Service Incidents
 While metrics provide valuable insights, incorporating end-user feedback and retrospective incident analysis is also important. Establish channels for users to report issues by formal processes to build up a good understanding of specific applications. This feedback can help identify hidden issues, intermittent issues or user-specific challenges that may not be evident through real time monitoring alone. Regularly solicit and analyze user feedback to make informed decisions for optimizing the EUC experience. Using a tool with automated integration into your organizations ITSM systems such as Jira, MS Teams, ServiceNow, AutoTask etc can help ensure data driven, efficient decisions and ensure responsibilities and communication between teams is smooth and traceable, see: Integration with multiple ITSM tools at the same time (eginnovations.com).
How to take an application-centric approach to EUC monitoring – 3 Advanced Master Steps
Monitoring technologies have evolved and for organizations committed to ensuring optimal digital end user and employee experience there are a wealth of modern options available. The uptake of these technologies has been somewhat slower in the EUC sector than many areas of IT but increasingly EUC is embracing methodologies and mature technologies widely used in cloud services markets.
Step 1: Use synthetic monitoring beyond logon simulators – Use full session simulation
Synthetic monitoring involves robot users performing steps to simulate how a real user might use or access a system. By repeatedly attempting to use a system at regular intervals from a variety of locations, synthetic monitoring can detect availability issues even when no real users are accessing a system and before real users encounter issues. When synthetic monitoring measures metrics and timings of individual steps performance degradations and patterns can be detected before they are perceivable to end users. In the EUC world though synthetic monitoring is often limited to logon simulations, testing whether desktops and apps are available and perhaps whether applications can be launched.
Even if an application can be successfully launched, it does not mean the application is usable or performant.
There are currently only a few specialist tools available capable of performing full session simulations in EUC environments – I’m only aware of 4 credible vendor solutions on the market: Tevron, Itexis, Automai and LoginVSI (LoginPI). We license Itexis’s AppsMon solution within eG Enterprise to provide this type of monitoring within a single console alongside infrastructure and real user monitoring (RUM) to offer a unique end-to-end comprehensive monitoring option for EUC.
For more information on Full Session Simulation, please see: Synthetic Application Monitoring – Active Monitoring (eginnovations.com).
Step 2: Adopt APM (Application Performance Monitoring) tools into EUC environments
In the wider IT markets, APM tools have become ubiquitous, popular tools include Datadog, eG Enterprise, Dynatrace and AppDynamics. Most APM tools (other than eG Enterprise) have very little, if any, domain support for EUC technologies such as Citrix, VMware, Nutanix and similar. APM tools can also be very pricey when used in EUC as their licensing models are usually designed around use cases that are somewhat different to those seen in EUC. And so, adoption by EUC IT teams of APM is relatively and surprisingly low. eG Enterprise is unique in its coverage spanning both EUC monitoring and APM, as such we have worked with most of the early adopters and innovators in EUC developing APM strategies with cost-effective licensing for EUC use cases.
Traditional EUC monitoring can only identify that there is a problem with application performance. eG Enterprise features such as Java transaction monitoring allow the root cause of issues to be automatically pinpointed when the issue lies in the Java code, application server (JBoss, Tomcat, WebLogic etc) or JVM.
Recent examples of customers who have expanded their use of eG Enterprise to include APM, include:
- A large hospital who was already using eG Enterprise to monitor their Citrix landscape and have added APM modules to monitor JVM and Java based applications published to the desktops. Using a single tool to troubleshoot applications deployed via Citrix has eliminated finger-pointing between the separate EUC and Application IT teams. Read more: Dutch University Hospital Guarantees Continuity of IT Landscape with Transparent End-to-end Monitoring of eG Innovations.
Similar code level monitoring capabilities are available for a number of coding frameworks including Java, .NET Core, .NET, PHP and Node.js.
Step 3: Leverage configuration auditing and configuration change tracking
Some modern EUC monitoring tools such as eG Enterprise include Configuration Change Tracking tools and Configuration auditing tools. These features help administrators ensure application versions are up to date, minimize the number of versions of an application in use and ensure that application patches or changes with unintended unwanted consequences are rapidly identified and rolled back.
Features such as eG Enterprise’s “Configuration Check” allow an administrator to define a golden template or use a specific component (e.g. server, OS or other) as a reference against which all other similar components will be compared and deviations / variations identified.
Learn a bit more about configuration change tracking, here: Configuration Management & Change Tracking for Observability (eginnovations.com).
eG Enterprise is an Observability solution for Modern IT. Monitor digital workspaces,
web applications, SaaS services, cloud and containers from a single pane of glass.
Final Thought
At the end of the day all the end users really care about is access to the applications they need to do their job and for those applications to be available and work without problems. If you take an application centric approach to EUC monitoring you will rarely go wrong as you are naturally focused on what the users need and care about!
eG Enterprise is an Observability solution for Modern IT. Monitor digital workspaces,
web applications, SaaS services, cloud and containers from a single pane of glass.
 Michael works as a Regional Sales Manager in the New York City Metropolitan area, supporting East Coast customers in a variety of sectors including finance, healthcare and government. Michael particularly enjoys EUC community events and user groups and can often be found at CUGC XL meetups. An avid golf and tennis player, Michael is open to a match or game if you meet him at an event!