 In today’s digital economy, most business services rely on IT applications. The increasing dependency on applications has resulted in the growing adoption of application performance monitoring (APM) solutions. The goals of an APM solution are:
- To ensure high application uptime, service reliability and great end-user experience
- To proactively diagnose performance problems so the respective stakeholder (application owner, IT Ops, DevOps, developer, etc.) can fix them before users notice them.
Modern APM solutions must not only have deep monitoring functionality, but they must also be able to provide actionable intelligence to simplify an administrator’s job in finding and fixing an application problem. Alerts on performance deviations, errors, warnings, bottlenecks, etc. are essential requirements for an APM tool. But the requirements of enterprise IT teams have expanded beyond this to also include context-aware alerting for fast and smart resolution of problems.
 Business-aware alerting: As IT infrastructures have evolved to be multi-tiered with inter-dependencies between tiers, monitoring in silos is no longer sufficient. Service owners need to know when the service is impacted, and so an APM tool should embed the intelligence to discover application topologies, and these topologies should, in turn, provide an admin with business-aware, service-level alerts. To support this, when any application component failures are detected, the states of all services that depend on the affected components should reflect the performance problem. This way, when users contact the helpdesk to report problems with the service, the helpdesk staff can quickly determine whether the complaint relates to a known problem with the service or not.
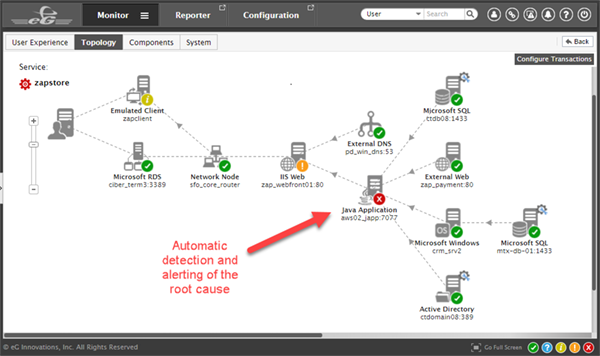
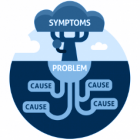 Root cause alerting: Determining the root cause of an application slowdown is one of the most difficult tasks for IT operations teams. Again, application inter-dependencies and infrastructure inter-dependencies make root cause alerting very difficult. A problem in one tier can ripple and affect several others. For root cause alerting, APM tools must consider inter-application and application-to-infrastructure dependencies. For example, a web application may be slow because of slow query processing in the backend database. In turn, the database server may be running on a storage device where one of the RAID array disks has failed and is limiting the throughput the device can support. Therefore, the database queries issued by the application are taking extra time. In this scenario, an APM tool should highlight the root cause (i.e., the storage device issue), and indicate all effects (i.e., database server slowness and application slowness). Accurate root cause alerting results in improved user satisfaction and higher service uptime. It also enables IT operations staff to spend less time fire-fighting problems, and enhances operations productivity.
 Aggregated alerting on farm-wide metrics: Large infrastructures have many servers in a farm/cluster. An administrator may only need to be alerted when, for example, four out of six web servers are facing connection spikes. This provides the actionable intelligence that is needed to determine when additional servers should be added to support the growing connection load. More complex conditions across multiple servers should also be supported. For example, an administrator may want to be alerted when 25% of servers are reporting CPU utilization above 80%. Such farm-wide alerts help administrators understand the health and capacity requirements of the entire farm (rather than just individual servers/nodes).
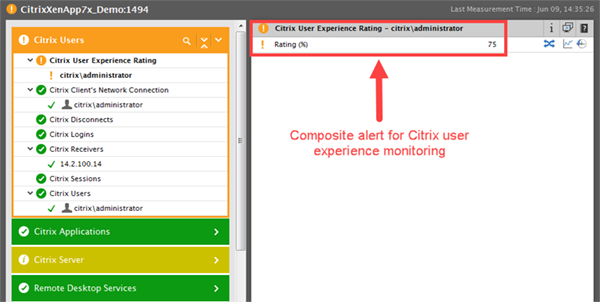
 Composite Alerting: Management-level reports must present simplified views of performance, instead of only detailed metrics. For example, consider a CIO who is interested in knowing if the user experience of a core virtual desktop service is good or not. There are many factors that affect the user experience, include a user’s logon time, application launch time, screen refresh latency, bandwidth availability etc. While an IT operations person is interested in the details, the CIO is not. The CIO is only looking for the overall user experience. APM tools must offer composite alerting functionality to simplify executive-level reporting. A composite alert is the collective representation of the state of multiple metrics. By assigning weights for different metrics (e.g. for logons, which happen less frequently and so may have a lower weight than screen refresh latency) and using a weighted average method, a composite rating is obtained – a simplified percentage value indicating user experience. Examples of composite alerts include user experience, Apdex score, stress level for servers, etc.
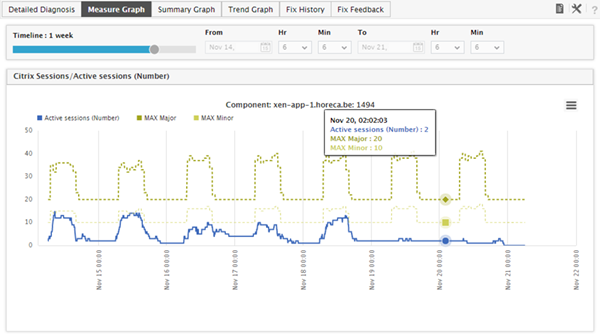
 Situation-aware dynamic baseline alerting: Manually adjusting alert thresholds for every performance metric is challenging. Based on usage trends, there is a need for different alert thresholds at different times of the day and for each day of the week. An admin would not need an alert triggered for the same threshold condition during the day – when there is high workload on an application server – as during low workload time at night or over the weekend. The best practice to determine these alert thresholds is by baselining the application and infrastructure performance. Some APM tools use artificial intelligence and machine learning to auto-baseline the infrastructure and dynamically determine alert thresholds. This is critical, as unless there is situational-awareness built into the APM solution, there would certainly be false positives for administrators, making their job more difficult.
eG Enterprise is an end-to-end application performance monitoring solution that includes all these comprehensive, intelligent alerting capabilities that help IT and business stakeholders get actionable insights for effective troubleshooting and decision-making. With out-of-the-box monitoring support for over 180 applications (Java, SAP, SharePoint, Citrix, PeopleSoft, etc.), eG Enterprise tracks health, availability and performance of all aspects of your business-critical applications and helps with proactive problem diagnosis and root cause analysis.
Learn more about APM with eG Enterprise »
eG Enterprise is an Observability solution for Modern IT. Monitor digital workspaces,
web applications, SaaS services, cloud and containers from a single pane of glass.


