Application performance monitoring (APM) is the practice of continuously measuring application speed, availability, errors, transactions, and user experience. It connects application behavior with code, databases, networks, and infrastructure so IT teams can detect issues, identify root causes, resolve problems faster, and keep business-critical services reliable.
Why is Application Performance Monitoring Important?
Application performance monitoring (APM) continuously tracks how applications behave and how users experience them. It measures availability, response time, errors, throughput, and transaction paths, then correlates those signals with code and infrastructure. This gives teams the context to spot anomalies, isolate bottlenecks, and optimize performance before users and business outcomes are affected.
How Does APM Work?
- Collect: Capture metrics, traces, errors, logs, and user-experience data.
- Monitor: Compare application health and business transactions with expected behavior.
- Trace: Follow requests across front ends, services, databases, and external calls.
- Correlate: Connect application signals with the supporting infrastructure.
- Identify root cause: Pinpoint the code, query, service, network, or resource causing the issue.
- Resolve and optimize: Fix the problem, validate recovery, and use trends to prevent recurrence.
In today’s digital economy, speed is everything. Especially for applications and websites accessed by end users, when there is slowness, it will have a direct detrimental impact on business productivity, profits and even the brand itself.
If an ecommerce application loads slowly or experiences errors, it will translate into loss of business, and the customer might end up switching to another website – possibly your competitor.
Whether it is a custom web application, VDI application, mobile application, or a packaged enterprise application such as SAP, Siebel, SharePoint, ensuring high performance and user experience in production defines the success of the application.
Why is My Application Slow? Best Practices for Troubleshooting
Given the complexity of today’s application infrastructures, this is not easy to achieve. Mobile app development platforms, cloud-native infrastructures, virtualized and containerized servers, dynamic and ephemeral application architectures, IoT, etc. make performance management a challenge. With the heterogeneous nature of the IT landscape and the various interdependencies between components, it is difficult to identify the cause of application slowness. One of the toughest questions application owners, developers and IT managers face is “Why is my application slow?”.
Slow is the New Down
 Over 73% of organizations experience loss of productivity due to performance slowdown in the application
- A 1 sec delay in website loading time can result in a 7% reduction in conversion and up to 16% decrease in customer satisfaction
When an application is slow, you’ll need to discover the following: why is it slow, since when, and what is causing slowness. This is where monitoring techniques come into play. Some of the traditional approaches to performance monitoring include executing ping tests on applications suspected to be slow, Telnetting to application ports for diagnosis, measuring server level metrics (CPU, memory, disk, etc.), and so on. But these are not sufficient to locate the bottlenecks in today’s distributed application environments. Organizations need to be able to connect the user journey with the application infrastructure and understand when, where, and why user experience is affected during application access.
Enter Application Performance Monitoring
Measuring the availability, response time and behaviour of each and every business transaction is key to understanding the user journey. When a user performs a transaction on a digital business service, the application owner needs to know:
- If the application is responding as it should
- Whether all the backend processes are being executed as they should
- If there is any slowness in transaction processing, which part of the application architecture is causing it
- Whether there is an error/bug in the application code, a problem in the application server or in the web front end, a query executing slowly, a hotspot in the backend database, slow network, etc.
So, monitoring must evolve from just looking at hardware metrics to analyzing application codes and business transactions. The performance of an application should be measured with a user -centric view. This forms the basis of application performance monitoring (APM).
What is APM (Application Performance Monitoring)?
 Application performance monitoring is the strategy and practice of continuously monitoring and tracking the performance of business applications and the user experience of end users as they access the applications to understand trends, isolate anomalies, and get actionable insight for problem resolution and code optimization.
Key Components of Application Performance Monitoring
An effective APM strategy should ideally be built on a clear understanding of what APM is, and should comprise the following:
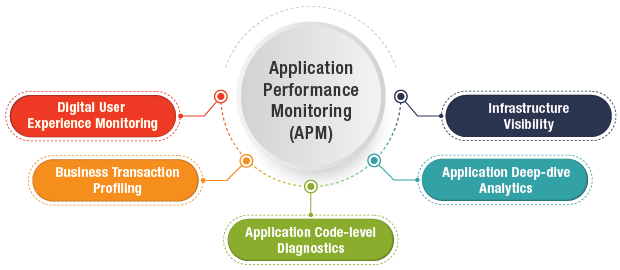
#1 Digital user experience monitoring: This deals with tracking the experience of application users and identifying times when they experience slowness, errors, downtime. There are two popular approaches to doing this: by synthetically simulating user transactions and testing them proactively from different locations; and by passively monitoring user experience of real users as they access applications in real time.
#2 Transaction profiling: This involves instrumenting byte-code during application runtime and analyzing the transaction flow through every tier of the application architecture to isolate where slowness is being caused. Using a tag-and-follow approach, business transactions can be traced through the front end, across the middleware, all the way to the backend database.
#3 Application code-level diagnostics: When transaction tracing reveals slowness is happening at the application server, the application developer needs to know if there is a problem in the application code. According to a DZone performance survey, 43% of application performance issues are due an issue in the application code. Transaction profiling usually provides the capability for developers and app owners to drill down into the code and get method-level processing time breakdown. When a user transaction is slow, it is then possible to pinpoint the exact line of code, database query or third-party call that is taking high processing time.
#4 Application deep-dive analysis: When there’s a problem in the application infrastructure – say in the application server when the connection pool is exhausted or there is high wait time for threads, or in the JVM or .NET CLR level when Garbage Collection is happening frequently or there is insufficient heap memory – it will affect application performance. Detailed visibility into the application infrastructure is a must.
 Performance troubleshooting for a Java web application
#5 Infrastructure visibility in context of application performance: Many application issues occur due to slow network connectivity, a memory leak in the server, virtualization bottlenecks, storage hotspots, etc. So, monitoring the health and availability of the supporting infrastructure is paramount to ensuring application performance success. Infrastructure monitoring should be in context of application monitoring, and ideally be integrated into an APM solution.
To answer the question “Why is the application slow?”, one needs to gain correlated insight into all aspects of user experience, business transactions, application performance and infrastructure health. A converged application and infrastructure monitoring strategy should be adopted to automate root cause diagnosis and simplify performance troubleshooting. From a single pane of glass, you can get your single source of truth and easily triage problems and ensure high performance of applications.
Application performance monitoring can be a breeze when you know how to do it right. Try eG Enterprise APM and experience the power of converged application and infrastructure monitoring incorporating all the aspects of APM discussed above!
How APM Improves Application Performance and Business Outcomes
- Faster troubleshooting: Correlated data reduces the time spent moving between tools and teams.
- Better user experience: Real-user and synthetic monitoring expose slow or failed journeys.
- Reduced downtime: Anomaly detection and early warning help teams act before degradation becomes an outage.
- Root-cause visibility: Transaction traces connect symptoms to the responsible code, service, database, or infrastructure tier.
- Improved operational visibility: Shared dashboards give application and infrastructure teams a consistent view of service health.
Online Demo: Converged Application & Infrastructure Monitoring

eG Enterprise is an Observability solution for Modern IT. Monitor digital workspaces,
web applications, SaaS services, cloud and containers from a single pane of glass.
Helpful Resources:
- Application Performance Monitoring Reality Check: Why Domain Expertise Matters
- Demo: Converged Application & Infrastructure Performance Monitoring
Frequently Asked Questions
Application performance monitoring (APM) is the continuous measurement and analysis of application availability, speed, errors, transactions, and user experience. It helps teams understand application behavior, find performance bottlenecks, and maintain reliable digital services.
APM tools collect application and user-experience telemetry, trace transactions across services, analyze performance against baselines, and correlate symptoms across code and infrastructure. They then identify likely root causes so teams can resolve and optimize issues faster.
APM is important because application speed and reliability directly affect productivity, revenue, and customer experience. It helps organizations detect degradation early, reduce downtime, shorten troubleshooting, and prioritize improvements using evidence rather than guesswork.
An APM tool typically monitors availability, response time, throughput, error rates, business transactions, code execution, database calls, external dependencies, real and synthetic user experience, and the infrastructure supporting the application.
APM helps troubleshooting by linking a slow or failed user transaction to the services, code, database queries, third-party calls, and infrastructure involved. This correlated view shows where time is spent and narrows the investigation to the most likely cause.
Application monitoring usually focuses on predefined health and availability metrics. APM goes deeper by tracing transactions, analyzing code-level behavior, measuring user experience, and correlating application performance with dependencies and infrastructure to explain why a problem occurred.
APM follows each transaction across the application stack and compares related telemetry at every tier. By correlating errors, latency, resource usage, code execution, and dependency behavior, it separates the original fault from downstream symptoms and pinpoints the likely root cause.
Look for end-to-end transaction tracing, real and synthetic user monitoring, code-level diagnostics, application and infrastructure correlation, automatic discovery, dependency mapping, anomaly detection, actionable root-cause analysis, broad cloud and technology coverage, useful integrations, scalable deployment, clear reporting, and predictable pricing.