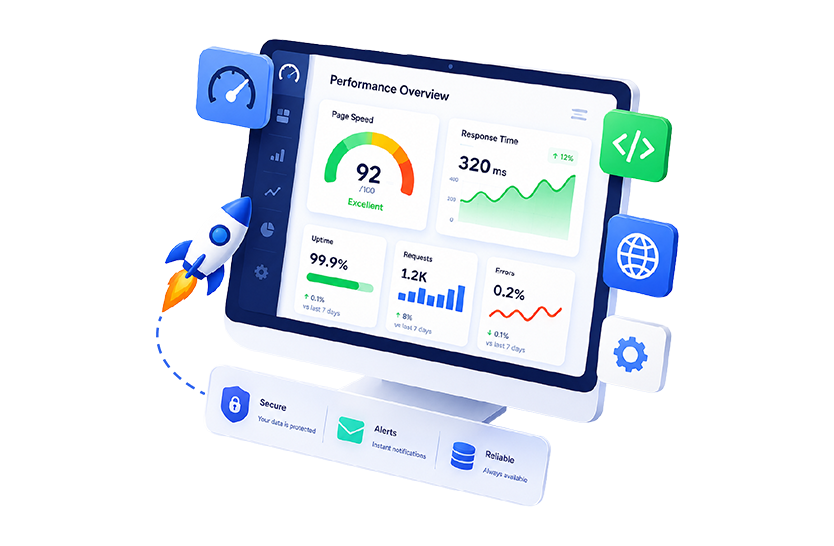
Digital experiences have become the primary way customers interact with businesses, public services and organizations. Whether customers are shopping online, accessing banking services, booking appointments, or using SaaS platforms, their perception of a brand is increasingly shaped by the performance and reliability of its digital services. This is where digital experience monitoring (DEM) becomes essential.
Even minor performance issues can have significant business impacts. Research from Deloitte found that a 0.1-second improvement in mobile site speed increased retail conversions by 8.4%, demonstrating the direct link between performance and revenue.
Rather than simply monitoring servers or applications, DEM measures how users actually experience digital services, helping organizations detect issues early, prioritize problems based on business impact, and continuously optimize application and website performance.
What is Digital Experience Monitoring?
Definition of Digital Experience Monitoring
According to Gartner, Digital Experience Monitoring (DEM) is the measurement of the availability, performance and quality of the user experience of applications. This can include internal users, external users, and digital agents connecting to APIs. DEM also enables observability of user behavior and journeys based on their interactions with applications.
Unlike traditional monitoring, which primarily measures infrastructure health, digital experience monitoring focuses on the quality of the user experience. It answers questions such as:
- How quickly did a page load?
- Was the application responsive?
- Did users successfully complete transactions?
- Are users in one geographic region experiencing slower performance than others?
How DEM Fits Within Observability and APM
Modern observability platforms collect telemetry data across applications, infrastructure, networks, and cloud environments. DEM complements these platforms by adding visibility into the actual end-user experience. While APM (Application Performance Monitoring) focuses on code execution, dependencies, and backend transactions, DEM focuses on the customer or employee experience.
Digital Experience Monitoring complements APM by measuring what users actually experience. While APM may show that application servers are healthy, DEM can reveal that users are still encountering slow page loads because of browser rendering issues, network latency, CDN problems, or third-party services.
Together, observability, APM, and DEM provide end-to-end visibility from infrastructure and application code all the way through to the user’s browser or mobile device.
How Digital Experience Monitoring Works
Digital experience monitoring continuously collects telemetry from multiple sources to build a complete picture of user experience.
Real User Monitoring collects performance data directly from users’ browsers and devices during normal application usage. Synthetic monitoring proactively tests applications by executing scripted user journeys from different locations, even when no users are active.
The most mature DEM platforms extend to APM and observability features to also monitor APIs, web servers, mobile applications, network performance, and cloud services while correlating this information with infrastructure and application telemetry.
Advanced digital experience monitoring tools apply AI and machine learning to correlate events across these domains, reduce alert noise, detect anomalies, and identify the root cause of performance issues much faster than manual investigation. Learn more: What is Event Correlation? And Why Does Event Correlation Matter when Monitoring? | eG Innovations.
Key Metrics Measured by DEM
Digital experience monitoring platforms measure a wide range of performance indicators that directly affect user satisfaction.
Page Load Time
Page load time measures how quickly a webpage becomes usable. Slow-loading pages increase bounce rates, reduce customer engagement, and negatively impact conversion rates. Continuous monitoring helps organizations identify bottlenecks before they affect users.
Core Web Vitals
Google’s Core Web Vitals measure key aspects of user experience and search performance:
- Largest Contentful Paint (LCP) measures loading performance.
- Interaction to Next Paint (INP) measures responsiveness.
- Cumulative Layout Shift (CLS) measures visual stability.
Monitoring these metrics helps improve both user satisfaction and SEO performance. Learn more: Understanding Core Web Vitals – Key Metrics for Optimizing Your Website for Better User Experience | eG Innovations.
Application Response Time
Application response time measures how quickly applications respond to user requests. Increased response times often indicate infrastructure bottlenecks, inefficient application code, overloaded databases, or network issues.
API Latency
Modern applications rely heavily on APIs connecting microservices, cloud services, and third-party platforms. API monitoring measures latency, availability, error rates, and response times to ensure these critical services continue operating efficiently.
Transaction Success Rate
Many business-critical applications depend on users successfully completing transactions such as purchases, account logins, or form submissions. DEM continuously monitors these user journeys to detect failures before they impact revenue or productivity.
Browser Performance
Browsers render applications differently depending on operating systems, browser versions, extensions, and device capabilities. DEM helps identify browser-specific performance problems that traditional infrastructure monitoring cannot detect.
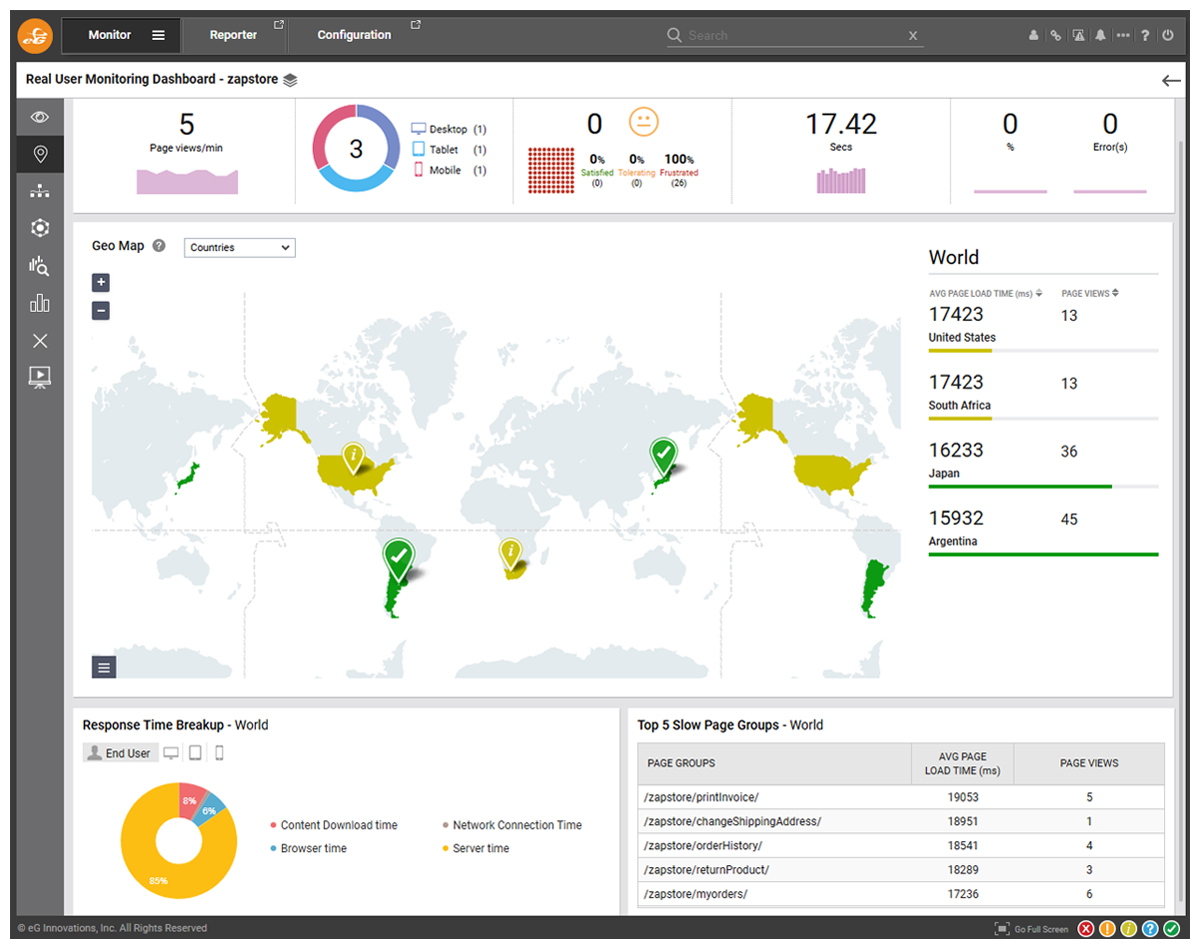
Geographic Performance
Users in different regions may experience dramatically different application performance because of network latency, CDN configuration, or cloud deployment choices. Geographic monitoring helps identify regional performance issues before they become widespread.
Availability
Availability monitoring ensures websites, applications, and digital services remain accessible around the clock. Rather than simply confirming servers are online, DEM verifies that applications are fully functional and capable of completing critical user transactions.
Why Digital Experience Monitoring Matters
Deliver Better Customer Experiences
Customer expectations continue to rise. Users expect fast, seamless, and reliable digital interactions regardless of device or location. DEM provides visibility into the complete customer journey and helps organizations identify friction points before they impact satisfaction.
Detect Performance Issues Before Users Notice
Many performance problems develop gradually before becoming major incidents. Small increases in response time, growing API latency, or regional network issues may initially affect only a small percentage of users. Synthetic monitoring and AI-driven anomaly detection enable organizations to identify these early warning signs before widespread service degradation occurs. Instead of reacting to helpdesk tickets or social media complaints, IT teams can proactively resolve issues before users notice them.
Reduce Revenue Loss from Slow Applications
Performance and revenue are tightly connected. Website and application speed have a direct impact on business performance and in many cases revenue outcomes.
Google found that:
- 53% of mobile visitors abandon pages taking longer than three seconds to load.
Akamai reported that:
- A 100-millisecond delay in website load time can hurt conversion rates by 7 percent.
- A two-second delay in web page load time increase bounce rates by 103 percent.
These statistics illustrate how quickly poor performance can impact customer acquisition and conversion rates.
Improve Website Reliability and Availability
Continuous monitoring of availability, uptime, and transaction success helps organizations identify outages quickly and reduce mean time to resolution. For those in some regulated industries such as banking, website outages can lead to regulatory fines and penalties if certain services are unavailable so website availability is a critical business objective.
Support Continuous Performance Optimization
Modern applications are constantly changing due to software releases, infrastructure modifications, and evolving user demand. Digital experience monitoring provides continuous feedback on how these changes affect users. Organizations can compare performance over time, identify regressions after releases, validate optimization efforts, and make data-driven decisions that improve digital experiences rather than relying on assumptions.
Many digital experience platforms now offer predictive analytics that provide trend analysis, data-driven capacity planning and resource sizing / optimization.
Types of Digital Experience Monitoring
Real User Monitoring (RUM)
Real User Monitoring (RUM) captures performance data from actual users as they interact with websites and applications. JavaScript running within the browser collects metrics such as page load times, browser performance, network latency, user locations, device types, and Core Web Vitals.
Because RUM reflects genuine user activity, it provides the most accurate view of customer experience while helping organizations identify issues affecting specific browsers, devices, operating systems, or geographic regions.
Synthetic Monitoring
Synthetic monitoring proactively tests applications by executing scripted user transactions from predefined locations around the world. These automated tests run continuously, even when no real users are active, to verify availability and measure application performance.
Synthetic monitoring is particularly valuable for monitoring login processes, ecommerce checkouts, customer portals, APIs, and other critical business transactions. By identifying failures before users encounter them, organizations can minimize downtime and improve service reliability.
The repeatable nature of synthetic monitoring also allows organisations to define critical workflows which can be benchmarked and used to measure and define quantitative SLAs and KPIs.
API Monitoring
Modern applications increasingly rely on APIs to connect microservices, cloud platforms, SaaS applications, and third-party services. For example, many websites use location-based searches provided by third-party APIs to fill in billing addresses and if the API fails to work correctly customers fail to complete transactions.
API monitoring continuously measures response times, availability, error rates and performance. By detecting API issues early, organizations can prevent failures from cascading through distributed applications and affecting the overall user experience.
Web Application Monitoring
Web application monitoring tracks the responsiveness, functionality, performance, and availability of business-critical web applications. Modern observability platforms can combine front-end user experience with back-end application performance to provide end-to-end visibility, tracking and correlating browser performance, server response times, application transactions, database performance, and supporting infrastructure.
Session Replay
Session replay is a RUM feature that recreates user sessions visually. Session replay records user interactions such as mouse movements, clicks, scrolling, navigation paths, and form interaction to recreate exactly how users experienced an application or website. When combined with performance telemetry, session replay allows developers and support teams to reproduce issues without relying solely on user descriptions and allows administrators and developers to see exactly what users experienced before an issue occurred.
Mobile Application Experience Monitoring
As mobile applications become increasingly important for customer engagement, organizations must monitor performance across iOS, Android, and hybrid mobile environments.
Mobile application monitoring measures launch times, crashes, network performance, API responsiveness, device-specific issues, and user interactions to ensure consistent digital experiences regardless of device or network conditions
Key Features to Look for in Digital Experience Monitoring Tools
Features that you may wish to look for in a digital experience monitoring tool, might include:
- Real user monitoring (RUM) — records the interactions of real users within a web application
- Synthetic transaction monitoring — simulated user interaction through scripts, bots, network traffic simulation or API tests
- Multiple geographic points of presence for synthetic transaction monitoring, and the option to deploy private agents for increased visibility
- Analysis of RUM telemetry such as session replay of the customer journey.
- SaaS application performance and availability monitoring.
- Benchmarking for key performance metrics for establishing baselines and comparison and trend analysis.
- AI-powered anomaly detection and the ability to provide actionable insights through the use of advanced analytics and machine learning that are otherwise not possible or feasible to derive through manual interrogation and analysis of data.
- Support for browser emulation and automation languages such as Selenium, Cypress, Playwright and Puppeteer.
- Internet performance monitoring — ability to provide insight into cloud services and the optimum paths available.
- Thick client monitoring — capability to deploy DEM to non-web-based interfaces.
- Mobile application monitoring via software development kits (SDKs).
- Automated root cause analysis.
- Full-stack correlation across infrastructure, applications, and user experience.
- Integrations with application performance monitoring or observability platforms to see a drill-down at the transaction level that shows how the application spends time when responding to a user request.
Common Use Cases For Digital Experience Monitoring
Digital Experience Monitoring (DEM) is used across many industries to measure, analyze, and improve the performance of digital services and applications. Common use cases include:
eCommerce Website Performance Monitoring
Online retailers rely on DEM to ensure shoppers can browse products, add items to their cart, and complete purchases without delays or errors. Monitoring page load times, checkout performance, and transaction success rates helps reduce cart abandonment and maximize revenue.
Banking and Financial Services Applications
Banks and financial institutions use DEM to monitor online banking portals, mobile banking applications, payment systems, and digital transaction services. Continuous monitoring helps ensure secure, responsive, and uninterrupted customer experiences.
Moreover these types of services are usually highly regulated and DEM is an important tool for protecting the organization from liabilities or regulatory fines for a failure in services such as consumer banking.
SaaS Platforms
Many organizations now consume large number of key business applications as SaaS. Ensuring these apps are performant is vital for employee productivity and satisfaction. Full-session synthetic monitoring is a particularly useful tool for validating SaaS applications are available and performant.
Healthcare Portals
Healthcare organizations use DEM to ensure patients and healthcare professionals can reliably access electronic health records, appointment scheduling systems, telehealth platforms, and patient portals. Where public health services are being delivered to the general public it is important services are proactively monitored as the general public are unlikely to raise support tickets in the same way as employees and are likely to be accessing resources on a very wide range of often legacy devices.
Customer Self-Service Applications
Organizations monitor customer self-service portals to ensure users can complete tasks such as paying bills, tracking orders, submitting support requests, or managing their accounts without encountering performance issues.
Digital Experience Monitoring vs Application Performance Monitoring
What DEM Measures
Digital Experience Monitoring measures how users experience an application. It captures metrics such as page load times, Core Web Vitals, browser performance, geographic response times, transaction success rates, and user interactions. DEM answers questions such as:
- Are users experiencing slow performance?
- Which locations are affected?
- Which browsers or devices have problems?
- Can users complete business transactions successfully?
Ultimately, DEM focuses on business outcomes and user satisfaction.
What APM Measures
Application Performance Monitoring focuses on the internal health of applications. It measures application response times, service dependencies, database queries, code execution, memory utilization, exceptions, and distributed transactions.
APM helps developers and operations teams understand how applications behave internally and identify performance bottlenecks within application code or supporting infrastructure.
When Organizations Need Both APM and DEM
Modern enterprises need both DEM and APM because excellent infrastructure performance does not always translate into excellent user experiences.
A web application may appear healthy from an infrastructure perspective while users experience slow page rendering because of browser issues, CDN latency, or third-party APIs. Conversely, DEM may reveal poor user experience while APM identifies the underlying application bottleneck responsible.
Together, DEM and APM provide complete visibility from application code to the end user’s browser, enabling faster diagnosis and more effective performance optimization.
DEM highlights user-facing impact while APM identifies the underlying technical causes.
Choosing the Right Digital Experience Monitoring Tool
Selecting the right digital experience monitoring platform requires more than simply comparing feature lists. Organizations should evaluate whether a solution can provide end-to-end visibility across increasingly distributed and dynamic IT environments.
Scalability
Modern monitoring systems collate enormous volumes of telemetry from web applications, cloud platforms, mobile devices, APIs, and infrastructure. A digital experience monitoring platform needs to scale effortlessly while maintaining real-time analytics and fast root cause analysis. Built in domain expertise needs to be built in to ensure the right metrics are prioritized and sampled efficiency as AI technologies need high quality inputs to generate meaningful outcomes.
Cloud and Hybrid Support
Most organizations now operate hybrid environments spanning on-premises infrastructure, multiple public clouds, SaaS applications, and container platforms. Monitoring tools should provide consistent visibility across all environments without creating operational silos. This means choosing DEM tools which also offer broad infrastructure and platform support beyond end user experience and browser-based features.
AI-Assisted Analytics
AI-assisted analytics reduce operational overhead by automatically detecting anomalies, correlating related events, prioritizing incidents, and identifying probable root causes. This enables operations teams to focus on resolving problems rather than manually interpreting thousands of alerts.
Integration with Observability Platforms
Digital experience monitoring should not operate in isolation. Integration with observability platforms, APM, infrastructure monitoring, ITSM solutions, and automation tools enables organizations to correlate user experience with application and infrastructure performance from a single source of truth.
Ease of Deployment
Modern monitoring solutions should support rapid deployment with automated discovery, pre-built integrations, and minimal ongoing maintenance. Faster deployment allows organizations to realize value quickly while reducing operational complexity.
Dashboards and Reporting
Where organizations are delivering websites and applications critical to business operations it essential that success can be quantified, tracked and proven. Enterprise-ready DEM tools must now go beyond monitoring to provide dashboards and automated reporting that provides the whole organization with clear views on performance and success.
Cost-effective Licensing
Many organizations find themselves curtailed in their abilities to scale and fully leverage DEM tool usage by licensing models that become prohibitively expensive. Synthetic monitoring licensing based on per test and per URL models often becomes prohibitively expensive and problematic when organizations attempt to scale its usage.
How eG Innovations Helps Improve Digital Experiences
Real User and Synthetic Monitoring
eG Enterprise provides both Real User Monitoring and Synthetic Monitoring, giving organizations visibility into actual user experiences while continuously testing critical business transactions.
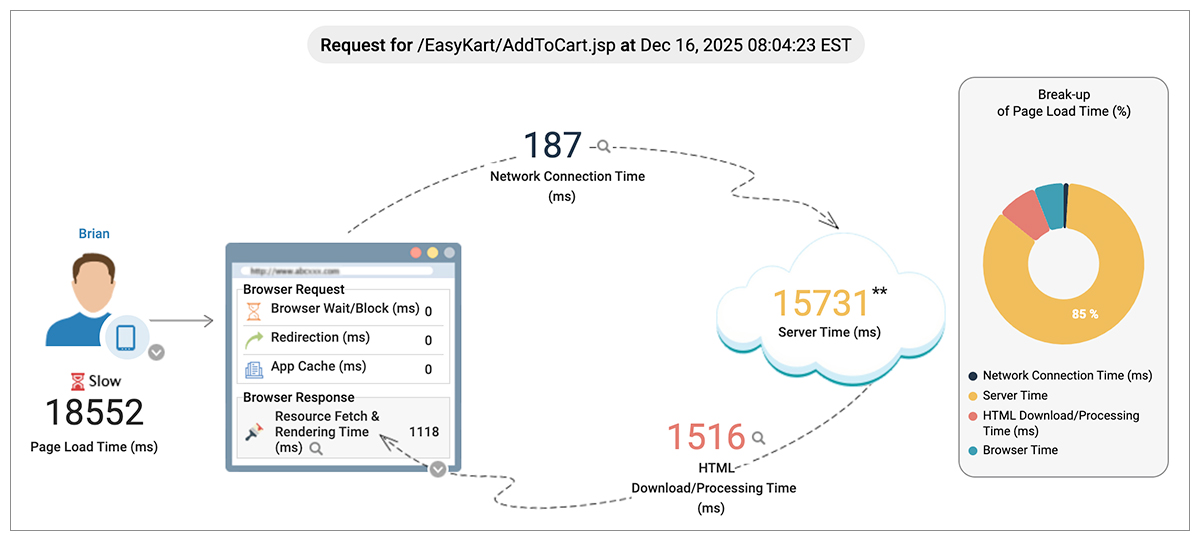
Real User Monitoring captures browser performance, user interactions, Core Web Vitals, and application responsiveness, while built-in Session Replay reconstructs user sessions, including clicks, scrolling, and navigation path, to understand real user journeys and accelerate troubleshooting.
Synthetic monitoring complements this by proactively testing websites, APIs, and business workflows from multiple locations, identifying issues even when no users are active. eG Enterprise also supports mobile application monitoring, extending visibility across native and hybrid mobile applications.
End-to-End Transaction Visibility
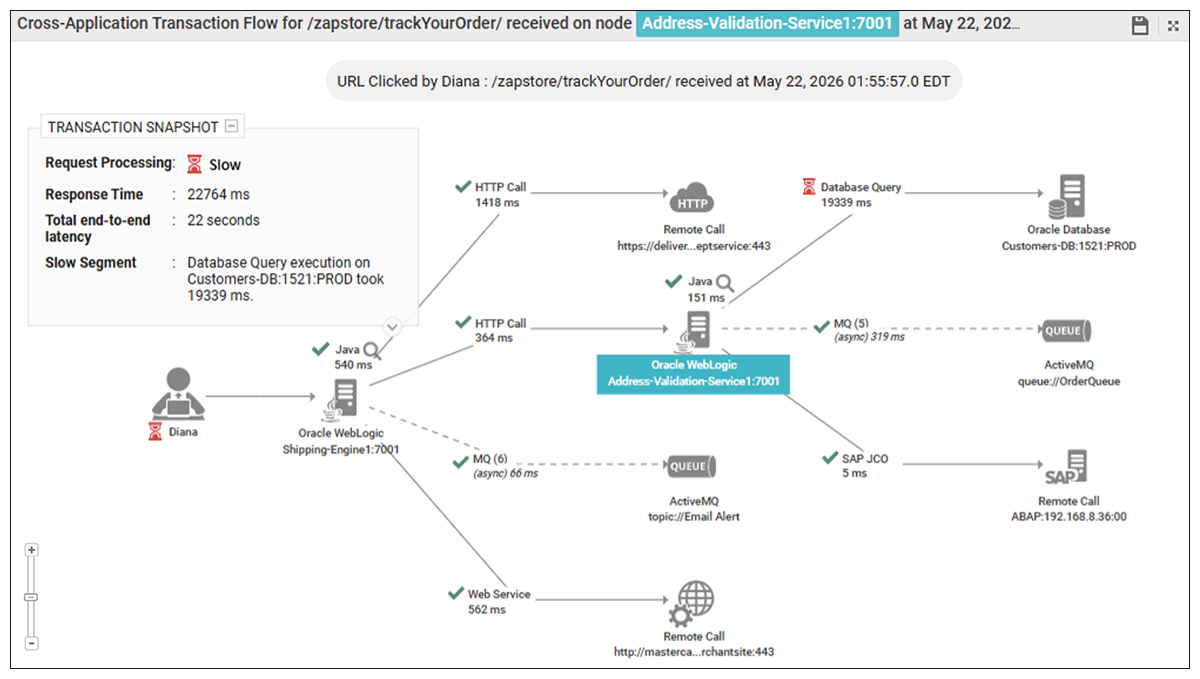
eG Enterprise traces transactions across browsers, web servers, application servers, databases, cloud services, and supporting infrastructure. This end-to-end visibility enables administrators to quickly understand where delays occur and how infrastructure performance affects the digital experience.
AI-Powered Root Cause Analysis
Rather than overwhelming administrators with alerts, eG Enterprise uses AI-driven analytics, dependency mapping, and cross-tier correlation to identify the most likely root cause of performance problems. By automatically correlating user experience with application and infrastructure telemetry, it significantly reduces troubleshooting time and accelerates incident resolution.
Full-Stack Observability Across Applications and Infrastructure
eG Enterprise delivers unified observability across cloud, hybrid, and on-premises environments. With built-in support for 650+ enterprise technologies, it correlates performance data from applications, databases, containers, virtualization platforms, cloud services, networks, and end-user devices to provide a single, end-to-end view of service health.
Cost-effective Licensing for Digital Experience Monitoring
Unlike many DEM monitoring tools and platforms, eG Enterprise avoids licensing models that become costly at scale. Our synthetic monitoring is licensed per test location with no limits on how many URLs or sites are monitored and unlimited tests are included. Flat pricing for real user monitoring also means that our customers aren’t penalized for having popular sites and services.
Conclusion
Digital experience has become a key differentiator for modern organizations. As applications become increasingly distributed across cloud services, APIs, and microservices, maintaining consistent performance requires visibility far beyond traditional infrastructure monitoring.
Digital Experience Monitoring enables organizations to understand exactly how users experience their applications, proactively detect issues, and resolve problems before they affect business outcomes. Combined with observability, APM, and AI-powered analytics, DEM helps IT teams deliver faster, more reliable digital services that improve customer satisfaction, employee productivity, and business performance.
eG Enterprise is an Observability solution for Modern IT. Monitor digital workspaces,
web applications, SaaS services, cloud and containers from a single pane of glass.