Why Azure Monitor for AVD misses critical performance issues, and how to fix them
Microsoft Azure Monitor is an essential platform service for monitoring Azure resources. It provides valuable telemetry, logs, metrics, and alerts that help administrators understand the health of their cloud infrastructure. For organizations running Azure Virtual Desktop (AVD), Azure Monitor is usually the first monitoring service they deploy.
However, as AVD environments grow in complexity, many IT teams discover that infrastructure monitoring alone is not enough to troubleshoot user experience problems. Slow logins, application delays, session disconnects, endpoint issues, and network bottlenecks need visibility beyond Azure resource metrics.
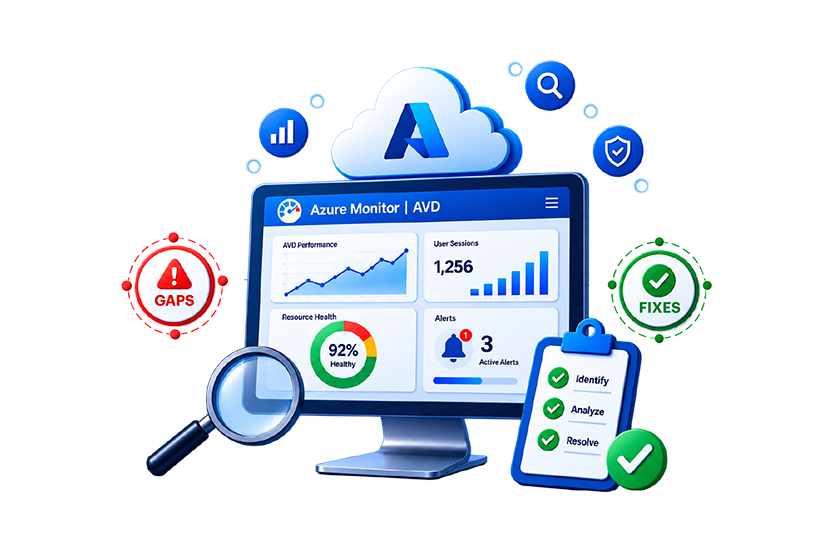
Azure Monitor for AVD is strong on infrastructure telemetry and thin on user experience. That gap is where most AVD tickets live.
Azure Monitor overview
Azure Monitor is Microsoft’s cloud-native monitoring service for Azure resources. It collects metrics, logs, traces, and diagnostic data from Azure services and enables administrators to create dashboards, alerts, workbooks, and reports.
For Azure Virtual Desktop, Azure Monitor provides Azure Virtual Desktop Insights, a dashboard built on Azure Monitor Workbooks, giving visibility into session hosts, host pools, user sessions, resource utilization, and diagnostic information.
What Azure Monitor does well
Azure Monitor offers several strengths for monitoring Azure environments:
- Collects infrastructure metrics from Azure resources
- Stores log and trace data in Log Analytics workspaces, query able with KQL, and surfaces AVD data through Azure Virtual Desktop Insights
- Supports alerting based on Azure metrics and logs
- Provides historical performance data
- Enables custom dashboards and workbooks
- Supports automation through Azure Monitor Alerts and Action Groups
- Integrates with other Azure management services
For teams whose question is whether the Azure infrastructure is healthy, that is enough.
Where Azure Monitor for AVD falls short
While Azure Monitor provides extensive infrastructure visibility, enterprise IT teams need broader observability to understand how employees actually experience Azure Virtual Desktop.
Time-consuming manual configuration and alert setup
Azure Monitor offers flexibility, but administrators spend real time configuring data collection rules, alerts, workbooks, and Log Analytics queries. Maintaining these configurations across multiple AVD deployments can increase operational overhead.
Difficult-to-predict monitoring costs
Azure Monitor pricing depends on factors such as data ingestion, log retention, queries, and optional services. As organizations expand monitoring coverage, forecasting spend gets harder as coverage grows.

Limited synthetic monitoring for AVD
Azure Monitor primarily collects telemetry from existing infrastructure. It does not provide comprehensive synthetic testing for complete Azure Virtual Desktop login workflows or business-critical user transactions, making proactive issue detection more difficult.
Cross-platform visibility takes extra onboarding and still is not correlated
Many enterprises operate hybrid environments spanning Azure, on-premises infrastructure, Microsoft 365, SaaS applications, Citrix, Omnissa Horizon, and AWS. Azure Monitor can reach beyond Azure through Azure Arc, but each estate has to be onboarded, each source needs its own data collection rules, and the resulting data still arrives as separate streams. Nothing ties a slow Citrix session and a struggling on-premises database to the same user complaint.
Limited digital workspace and cross-platform monitoring
User experience depends on much more than Azure resources. Endpoint health, Wi-Fi quality, browser performance, authentication services, application dependencies, and network conditions all contribute to AVD performance. These components are not comprehensively correlated within Azure Monitor.
Manual dashboard creation and KQL-based reporting
Although Azure Monitor supports highly customizable dashboards and reports, administrators rely on Kusto Query Language (KQL) to build meaningful visualizations. Creating and maintaining these dashboards and reports requires specialized expertise and ongoing effort.
Limited help desk views and automated root cause analysis
When users report slow virtual desktops, help desk teams need an answer they can act on in minutes. Azure Monitor provides the telemetry and leaves the investigation to the administrator. It does not automatically correlate infrastructure, applications, endpoints, and user experience to identify the root cause of performance issues.
Common AVD issues Azure Monitor misses
Many Azure Virtual Desktop issues originate outside Azure infrastructure itself.
Examples include:
- Slow logins caused by authentication delays or FSLogix profile issues.
- Endpoint CPU or memory constraints.
- Wi-Fi instability affecting remote workers.
- Network latency between users and Azure.
- Backend application bottlenecks.
- Microsoft 365 performance degradation.
- Browser-related issues.
- Multi-tier application dependencies.
- Digital employee experience (DEX) degradation before infrastructure thresholds are exceeded.
Without end-to-end correlation, these problems take far longer to diagnose.
Azure Monitor for AVD vs. enterprise AVD monitoring
Azure Monitor is designed to monitor Azure resources, whereas enterprise monitoring platforms focus on the complete digital workspace.
An enterprise solution combines Azure infrastructure metrics with user experience, application performance, endpoint health, networking, authentication, storage, and virtualization platforms into a single correlated view.
An enterprise platform adds the correlation layer Azure Monitor leaves to the administrator. That is what shortens the hunt for a root cause.
How eG Enterprise Goes Beyond Azure Monitor
eG Enterprise covers the whole AVD delivery chain, from the Azure subscription and host pools down to the session host and the endpoint the user is sitting at.
eG Enterprise correlates metrics across Azure infrastructure, session hosts, applications, endpoints, networks, identity services, storage, and user sessions.
Instead of adding another checklist, eG Enterprise shows how that enterprise capabilities work in practice:
- Synthetic AVD logon testing: eG Enterprise’s AVD logon simulator runs 24×7 from strategic locations to test the full sign-in path before users complain. It tracks logon duration and failures, captures screenshots when failures occur, and helps teams pinpoint whether the issue is tied to brokering, identity, FSLogix, storage, or another stage of the logon workflow.
- Synthetic full-session simulation: eG Enterprise also offers full session simulation for both thin and thick client apps allowing administrators to record full user workflows logging onto desktops and using apps within them. Learn more: Universal Synthetic Monitoring with eG Enterprise.
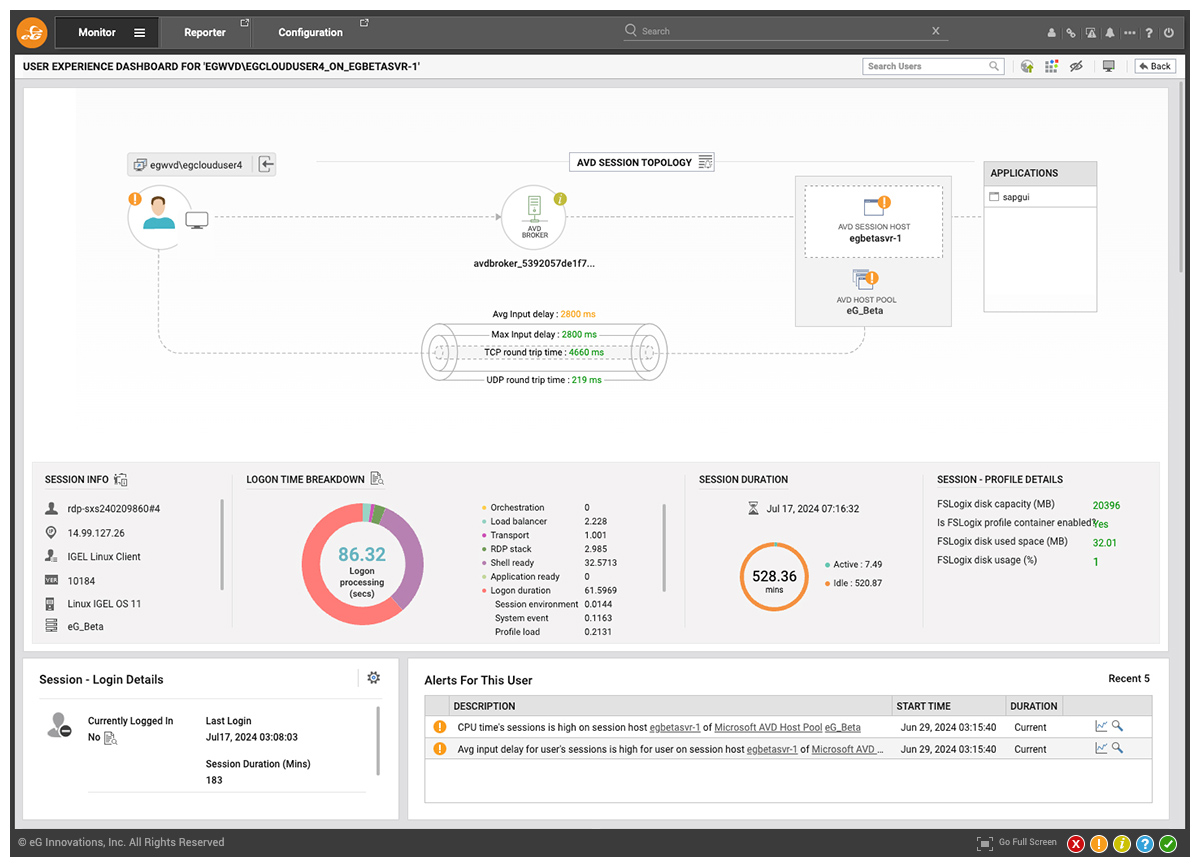
- Real user experience monitoring: Lightweight monitoring on session hosts captures what users actually experience, including latency, bandwidth usage, jitter, app launch time, screen latency, and input delay.
- Full-stack AVD dependency visibility: eG Enterprise monitors the AVD delivery chain across host pools, session hosts, connection brokering, the Azure subscription, identity services, storage, applications, endpoints, and networks so teams can see where a user-impacting issue begins.
- AIOps-driven root cause diagnosis: Auto-discovery, auto-baselining, automatic correlation, and root cause analysis connect symptoms across layers, reducing the manual investigation that Azure Monitor leaves to administrators.
- Operational reports and dashboards: Prebuilt views for usage, top users, top applications, load balancing, active and idle time, and compliance reporting give admins and help desk teams answers without building every view from KQL.
- Hybrid digital workspace coverage: The same console can monitor AVD alongside Citrix, Omnissa Horizon, Microsoft 365, Amazon WorkSpaces, on-premises infrastructure, and other digital workspace technologies, which helps enterprises manage mixed environments without switching tools.
By reducing manual investigation and correlating performance across every layer of the digital workspace, eG Enterprise shortens the time IT teams spend working out which tier failed.
Conclusion
Organizations that need complete visibility into user experience, applications, endpoints, networks, and hybrid infrastructure often complement Azure Monitor with an enterprise observability platform. By combining Azure-native telemetry with AI-powered root cause analysis, Digital Employee Experience monitoring, and proactive performance analytics, eG Enterprise helps organizations deliver faster issue resolution and consistently high-performing Azure Virtual Desktop environments.
See how eG Enterprise handles Azure Monitor for AVD gaps in your own environment. Book a demo with an engineer, or start a free trial and point it at one host pool.
eG Enterprise is an Observability solution for Modern IT. Monitor digital workspaces,
web applications, SaaS services, cloud and containers from a single pane of glass.
Frequently Asked Questions
Azure Monitor provides valuable visibility into Azure infrastructure, metrics, logs, and Azure Virtual Desktop resources. However, organizations that require Digital Employee Experience monitoring, endpoint visibility, synthetic monitoring, and automated root cause analysis supplement Azure Monitor with an enterprise monitoring platform for complete end-to-end observability.
Azure Virtual Desktop Insights is a monitoring capability built on Azure Monitor that provides dashboards and analytics for host pools, session hosts, user sessions, connections, and resource utilization. It helps administrators understand AVD health. Its scope is Azure-based telemetry.
Azure Monitor collects telemetry from Azure services and requires administrators to correlate logs, metrics, dashboards, and queries across multiple components. Without automated cross-domain correlation of applications, endpoints, infrastructure, and user experience, identifying the precise root cause takes real investigation.
Most enterprises benefit from using Azure Monitor for Azure-native infrastructure monitoring while complementing it with an enterprise observability platform such as eG Enterprise. This combination provides end-to-end visibility, Digital Employee Experience monitoring, AI-powered root cause analysis, and unified monitoring across hybrid environments.
Azure Monitor provides visibility into Azure Virtual Desktop resources and performance metrics but offers limited insight into the complete end-user experience. Organizations need additional capabilities such as Real User Monitoring, endpoint and DEX monitoring, synthetic monitoring, and Digital Employee Experience analytics to understand how employees actually experience virtual desktops.