What is AWS EC2?
 Amazon Elastic Compute Cloud (Amazon EC2) is a web service that provides secure, resizable compute capacity in the cloud. It is designed to make web-scale cloud computing easier for developers. Amazon EC2’s simple web service interface allows you to obtain and configure capacity with minimal friction. It provides you with complete control of your computing resources and lets you run on Amazon’s proven computing environment.
Amazon EC2 offers a broad and deep compute platform with a wide range of choices of processor, storage, networking, operating system, and purchasing models. EC2 also offers GPU enabled instances for machine learning training and graphics workloads. Typical workloads deployed include SAP, HPC, Machine Learning, and Windows workloads.
Most instances available are Virtual Machines (VMs) virtualized upon a Xen-based hypervisor, although Amazon have diversified with some compute VMs based upon Nitro (a flavor of KVM) and even some bare-metal instances. The EC2 web service allows organizations to rent computational resource and the associated infrastructure upon demand to scale up or down as needed and auto-scaling features of EC2 allow organizations to automatically adapt computing capacity to site traffic.
What is AWS CloudWatch?
Amazon CloudWatch is a monitoring and observability service originally built for DevOps engineers, developers, site reliability engineers (SREs), and IT managers. CloudWatch collects monitoring and operational data in the form of logs, metrics, and events from AWS resources, applications, and services that run on AWS and on-premises servers. With investment in staff skillsets and configuration, CloudWatch can be used to detect anomalous behavior in your environments, set alarms, visualize logs and metrics side by side, take automated actions, troubleshoot issues, and discover insights to keep applications running smoothly.
CloudWatch can be used to monitor more than 70 AWS services, such as Amazon EC2, Amazon DynamoDB, Amazon S3, Amazon ECS, Amazon EKS, and AWS Lambda. It automatically publishes 1-minute metrics and custom metrics with up to 1-second granularity. You can also use CloudWatch in hybrid cloud architectures by using the CloudWatch Agent or API to monitor your on-premises resources to some extent.
Basic Monitoring of AWS EC2 (Elastic Compute Cloud) with AWS CloudWatch
CloudWatch is Amazon’s native cloud monitoring solution for AWS. AWS Cloud Services itself was initially instrumented for quicker service provisioning within Amazon by and for their developer community and was later extended to the public for similar purposes. Today, AWS is extensively used by businesses for their dev, staging, test and production needs, especially the Elastic Compute Cloud (EC2). As AWS’ initially focus was not concentrated on meeting production requirements, service provisioning and its management have evolved in a way that does still feel developer-led and some workflows feel slightly too complex and manual for IT administrators, particularly those from an EUC and/or on-premises background.
The default basic entry-level tier for CloudWatch is free but to monitor beyond this level you will need to move to the paid tiers that are priced on a pay-as-you-go (PAYG) basis associated with the number of metrics you sample and record and data volumes. It is highly likely that most organizations will need to use the paid tier.
What are the Limitations of Basic Monitoring of AWS EC2 that CloudWatch provides?
Amazon CloudWatch is basically a metrics repository. An AWS service—such as Amazon EC2—puts metrics into the repository, and you retrieve statistics based on those metrics. If you put your own custom metrics into the repository, you can retrieve statistics on these metrics as well.
- Out-of-the-box, basic monitoring for EC2 with CloudWatch is agentless and configured to monitor a handful of metrics at a sampling interval of 5 min.
The default metrics passed to and out of CloudWatch are similar to “hypervisor-based metrics” for VMs provided by VMware, Citrix, and others. It tells you what resources the VM is using (e.g. how much CPU?) but will not give details (e.g. which application processes are consuming CPU?).
The basic free tier includes:
- Basic Monitoring Metrics (at 5-minute frequency)
- 10 Detailed Monitoring Metrics (at 1-minute frequency)
- 1 million API requests (not applicable to GetMetricData and GetMetricWidgetImage)
- 3 dashboards for up to 50 metrics per month
- Alarms, 10 alarm metrics (not applicable to high-resolution alarms)
- Logs, 5GB data (ingestion, archive storage, and data scanned by Logs Insights queries)
Which metrics are collected under-the-hood is defined within a config.json file to monitor system-level details. The table below shows the default metrics collected.
| Amazon Elastic Compute Cloud (EC2) metrics for each cloud instance (monitored agentless) | ||
| CPUCreditBalance | CPUCreditUsage | CPUSurplusCreditBalance |
| CPUSurplusCreditsCharged | CPUUtilization | DiskReadBytes |
| DiskReadOps | DiskWriteBytes | DiskWriteOps |
| EBSReadBytes | EBSReadOps | EBSWriteBytes |
| EBSWriteOps | NetworkIn | NetworkOut |
| NetworkPacketsIn | NetworkPacketsOut | StatusCheckFailed |
| StatusCheckFailed_Instance | StatusCheckFailed_System | |
By default, the monitoring tab for each instance will show a dashboard available containing a subset of these metrics (see Figure 2). The default parameters on CloudWatch are set to monitor basic metrics (shown in the table):
- CPU: CPU Utilization, CPU credit usage (count), CPU credit balance (count)
- Disk: Disk reads (bytes), Disk read operations (operations), Disk writes (bytes), Disk write operations (operations)
- Network: Network in (bytes), Network out (bytes), Network packets in (count), Network packets out (count)
- Status check failed (count): any, instance, system
- Out-of-the-box Amazon’s CloudWatch does not report system-level memory metrics for instances. Memory monitoring is not available by default in CloudWatch and must be enabled using (Memory % Committed Bytes In Use (Win), mem_used_percent (Linux)), parameters and an OS-specific agent. The CloudWatch agent can also report many parameters from the PerfMon list available when enabled. As RAM usage is a key metric of instance usage and performance, this is one reason why most users must consider implementing agent-based monitoring.
- Also note that while the above metrics can be used to determine which instance is using more resources, you cannot get additional details – e.g., which application running on the cloud instance is taking up CPU resources.
What Basic Monitoring of AWS EC2 Looks Like
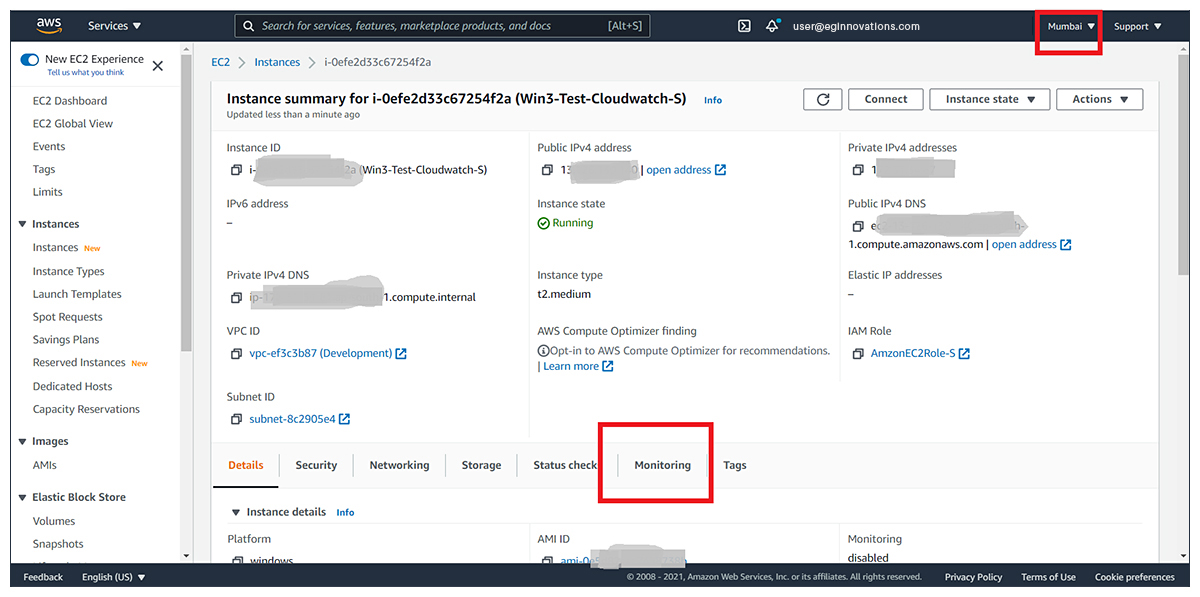
Ensure you are in the region where your EC2 resources have been provisioned (highlighted top right) and switch to the Monitoring tab.
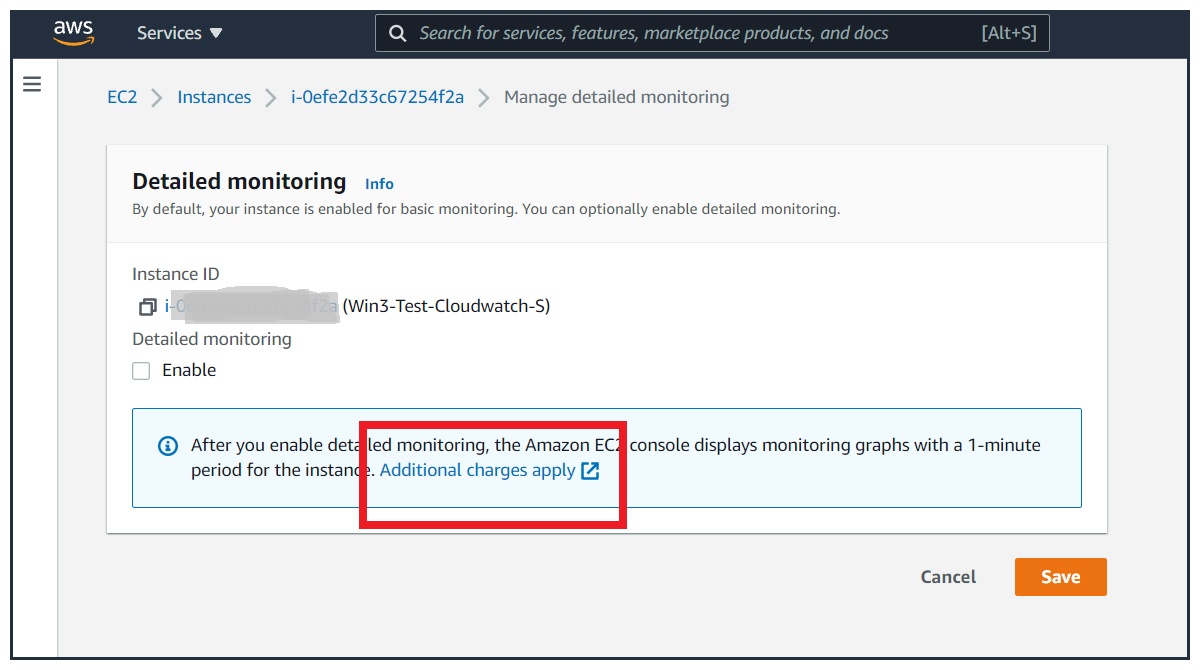
Once switched to the monitoring tab, you will see graphs of the basic metrics. From here you can opt to configure “Detailed monitoring”.
In practice, detailed monitoring means adjusting the basic metrics to be collected more frequently than the default 5-min sampling interval. If you choose to do this – additional charges will be incurred and you are warned of this (although no details are given as to how much these additional charges will be).
Types of AWS Status Checks
There are two types of status checks: system status checks and instance status checks.
-
System status checks: System status checks monitor the AWS systems on which your instance runs. These checks detect underlying problems with your instance that require AWS involvement to repair. When a system status check fails, you can choose to wait for AWS to fix the issue, or you can resolve it yourself.
For instances backed by Amazon EBS, you can stop and start the instance yourself, which in most cases results in the instance being migrated to a new host.
For Linux instances backed by instance store, you can terminate and replace the instance.
For Windows instances, the root volume must be an Amazon EBS volume; instance store is not supported for the root volume. Note that instance store volumes are ephemeral, and all data is lost when the instance is stopped.
The following are examples of problems that can cause system status checks to fail:
- Loss of network connectivity
- Loss of system power
- Software issues on the physical host
- Hardware issues on the physical host that impact network reachability
-
Instance status checks: Instance status checks monitor the software and network configuration of your individual instance. Amazon EC2 checks the health of the instance by sending an address resolution protocol (ARP) request to the network interface (NIC). These checks detect problems that require your involvement to repair. When an instance status check fails, you typically must address the problem yourself (for example, by rebooting the instance or by making instance configuration changes).
The following are examples of problems that can cause instance status checks to fail:
- Failed system status checks
- Incorrect networking or startup configuration
- Exhausted memory
- Corrupted file system
- Incompatible kernel
In my next blog post, I will cover how you can gain additional insights above agentless monitoring by deploying the CloudWatch agent, what this provides, and some of the limitations you need to plan for. I will also cover some of the cost and licensing implications of going beyond the free and basic tiers of CloudWatch.

eG Enterprise is an Observability solution for Modern IT. Monitor digital workspaces,
web applications, SaaS services, cloud and containers from a single pane of glass.
Learn More
- AWS Performance Monitoring with eG Enterprise – An overview of key capabilities and features
- Read about Synthetic Monitoring and Testing for Amazon WorkSpaces: Synthetic Monitoring of Amazon Workspaces | eG Innovations
- Read how Israel’s largest supermarket chain leverages an eG Enterprise integration with CloudWatch to manage large and complex auto-scaling deployments: Cloud Issues & Problems – Management Case Study | eG Innovations
- A real-life deep-dive post-mortem case study – debugging slow performance on AWS public cloud burstable instances on EC2, see: AWS EC2 Monitoring Tools | eG Innovations
- More on how eG Enterprise leverages AIOps technologies for event correlation, anomaly detection and root-cause diagnostic analysis: AIOps Tools – 8 Proactive Monitoring Tips
- Cloud Migration Strategy: A Framework for Cloud Adoption and Target Cloud Models – Define your Pathway to Cloud Migration