


How to Troubleshoot Java Application Slowness: A Real-World Example
In this blog, I’ll cover a real-world example of application performance troubleshooting a Java web app, hosted on JBoss Wildfly using Microsoft SQL as the backend database, including details of the analysis and diagnosis we had to perform in order to identify the root-cause of, and resolve, the performance issue. The issue manifested with symptoms including high CPU in the JBoss JVM, elevated garbage collection and database connection issues including timeouts – the issue was isolated to an issue in the JDBC database driver used by the application server and not in the database server itself. The full analysis below should give the reader insight into how to identify and eliminate other issues and a deeper understanding of the full stack between the JVM and database, and how even a small component of an application delivery chain, such as a driver, can significantly affect application performance.
Application Performance was Poor: Where was the Bottleneck?
The application in question was a Java-based web application, deployed using JBoss Wildfly as the web application server and utilizing Microsoft SQL as the backend database. SQL had been configured in an active/passive clustering mode for high availability. Java 12 was used for the application and jTDS was the JDBC driver used by the application to access the database.
The application had been newly deployed in production and had been working acceptably until user load increased. With the increase in load, the application became slower and slower. The customer’s IT team did not have the expertise to assist with the diagnosis and our professional services team was engaged to assist them in identifying the cause of the application slowdown.
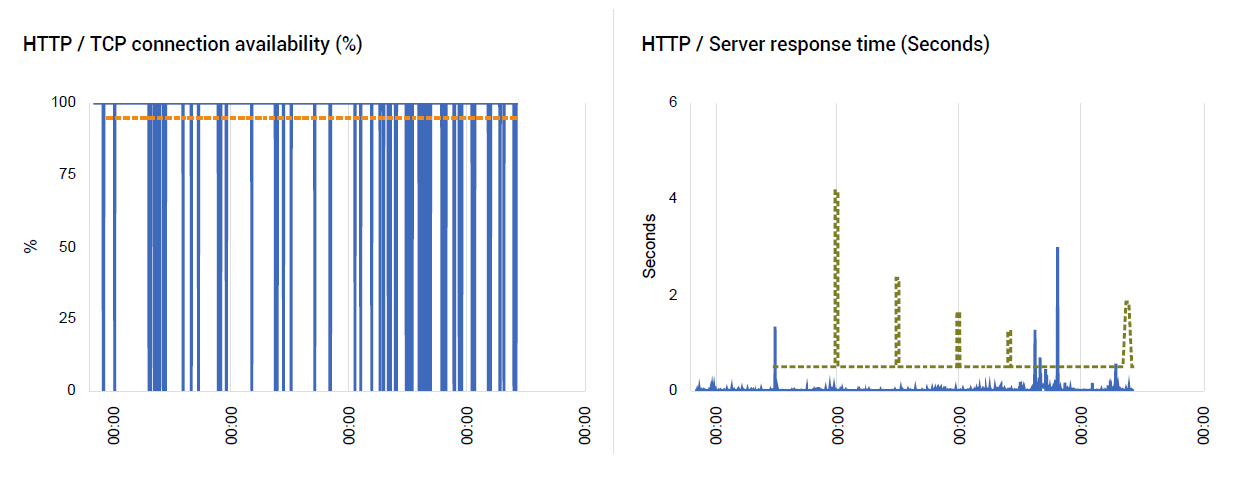
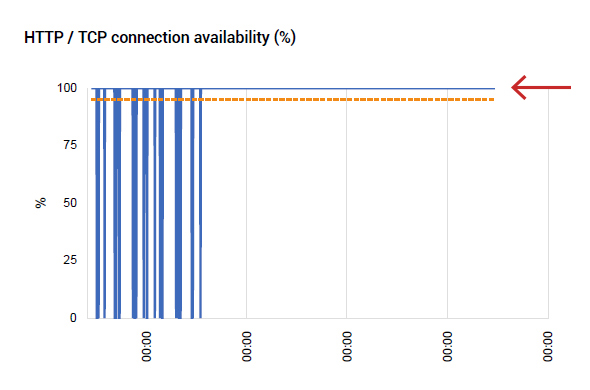
Synthetic monitoring of the web application using eG Enterprise indicated that there was a problem. While web response times were acceptable, there were many connection timeouts seen and as a result the JBoss web server availability metrics indicated problems occurring multiple times daily (see Figure 1).
Troubleshooting Whether the Application Tiers were Slow
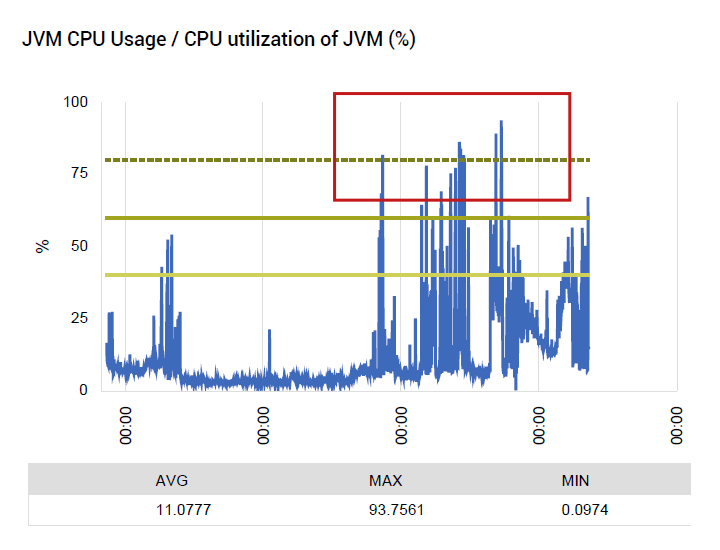
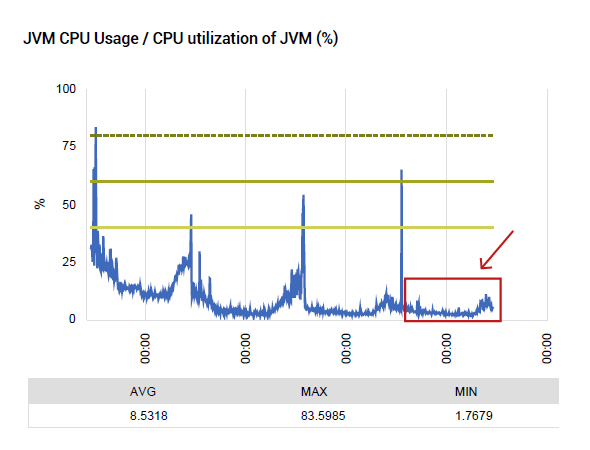
Agents were deployed on all the key tiers of the application to get an inside view of performance. JMX (Java Management Extensions) was used to track the Java virtual machine performance. CPU usage of the JBoss JVM was seen to have spiked significantly with increased load (see Figure 2).
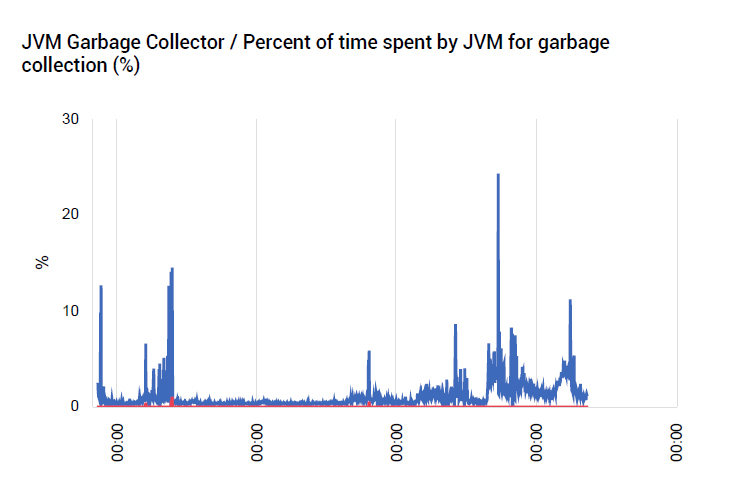
Analysis of the JVM’s garbage collectors indicated that garbage collection was taking more time than previously. Garbage collections can also increase if there is a memory leak in the application; however, our analysis did not find evidence to indicate that there was a memory leak. Excessive garbage collections can increase a JVM’s CPU usage, so CPU usage could have been an effect and garbage collection the trigger for this. The next question was why GC activity had gone up?
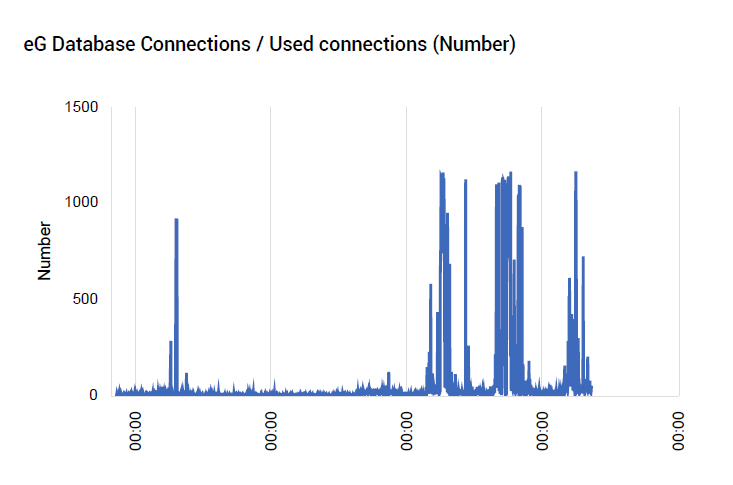
Around the time CPU usage and GC activity had increased, we also observed a significant increase in the number of connections from the application server to the database server. During normal operation of the application, only a small number connections (10 or so) were used. But when the application slowdown happened, almost a thousand connections to the database were in use. This seemed to indicate that there was a problem in the either the database tier or communication with that tier.

Is the Database Tier Slow?
When this finding was reported, the database team were adamant that the database tier itself was functioning correctly. All the monitoring and diagnosis tools they were using did not indicate any slowness on their database servers.
The SQL database had been configured in an active/passive cluster and SSL was enabled for all connections. Domain authentication was configured so only domain authenticated users could access the database server.
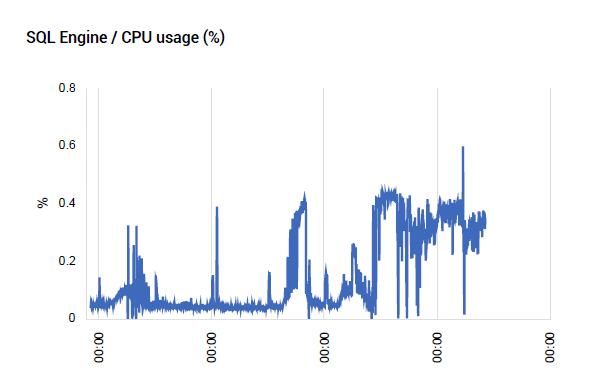
Monitoring of resource utilization levels on the database servers did indicate that the database team was correct and provided data to validate their conclusions. CPU utilization was well below 1% (see Figure 5). There was also no evidence of any long running queries, query blocking, high I/O activity like full table scans, etc. So where was the issue? This was the perplexing question.
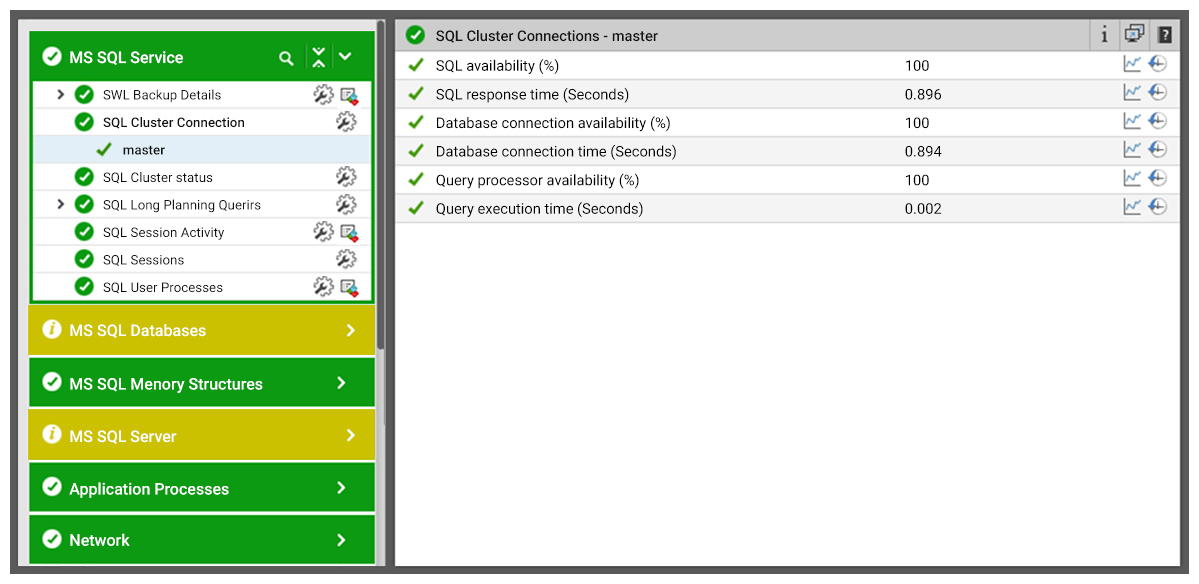
External monitoring of the database server gave a clue. See Figure 6. This indicated that when a connection to the database server was initiated, a query was issued and the response processed, over 99% of the time was spent in connection establishment. The query itself was executed very quickly. This was surprising to all the teams involved.
Where was the Problem Then?
Although the database tier was working well, there were thousand plus connections used by the application to access the database tier. To investigate this further, we checked the status of Java threads in the application server’s JVM. We could see several hundred threads were stuck waiting on the jTDS JDBC driver (see Figure 7). Reading the stack traces bottom up, we could see that when the application used the JDBC driver to connect to the database, the driver had issued a call to the getMAC function which in turn used Java’s NetworkInterface class. All of the Java threads on the application server were waiting on the Java NetworkInterface class.

What is a Database Driver?

A database driver is a software component that enables an application to interact with a database the database server. The drivers used depends upon the language used for the application. Under-the-hood, a database driver converts the SQL queries issued by an application into a protocol language that enables it to communicate with a database server and accept the returned results from the query back into the application.
To connect with individual databases from a Java application, the JDBC (Java Database Connectivity API) requires drivers for each database. The JDBC driver gives out the connection to the database and implements the protocol for transferring the query and result between client and database.
JDBC technology drivers fit into one of four categories.
- JDBC-ODBC bridge
- Native-API driver
- Network-Protocol driver (Middleware driver)
- Database-Protocol driver (Pure Java driver) or thin driver.
The Java thread analysis corroborated our other evidence – that for some reason, connecting to the database server was taking far more time than the execution of a query on the database tier. The fact that the Java threads were waiting on a local method call (java.net.NetworkInterface.getByInetAddress0) and not on the database server indicated that the performance bottleneck seemed to be on the application server end, i.e. within the JDBC driver used by the application server and not in the database server itself.
Diagnosing and Resolving the Application Performance Issue
We were able to identify the issue by analyzing the JDBC driver’s code. Every time a connection was required to the database, the socket’s local address was obtained and through it the local network interface address was obtained (see lines 296 of Figure 8). The hardware address for this network interface was determined and the driver was communicating this information back to the database server (see lines 297 of Figure 8). This was being done because SQL server is licensed by unique clients accessing it and the database driver is identifying the client using the MAC address of the network interface it is using.

What we discovered was that if the system on which the jTDS driver was executing (i.e., the client system accessing the database server) had a few network interfaces, finding the MAC address could be done in a few milliseconds. However, as the number of network interface cards on the client system increased, so did the time taken to find the MAC address!
 | So the performance bottleneck was in the database driver used by the application server and not in the database server itself! |
A closer look at the code revealed that the IP address to hardware address resolution is done every time a new connection is established. The application server used database connection pooling. During normal circumstances, connections were pre-loaded in the pool and the application performance was good because connection establishment was done when the application started and not when users accessed the application. When the application server had high load, additional connections were needed, and it was at this time that new connections were attempted to the database server. It was when there were additional requests to be processed, the database connection establishment became a problem and it was this that caused the slowness in application access.
| To resolve the problem, the database driver code was modified. A mapping of local IP address to hardware address was maintained in a memory cache in the database driver. Since the application only used the same local address each time, it meant that the hardware address was obtained from the memory cache itself. This saved significant time during database connection establishment. |
Another option, to address the same problem, would have been to detect the MAC address manually and to specify this in the jTDS URL format. See the jTDS URL format below and a specification of how the MAC address can be provided in the URL itself.

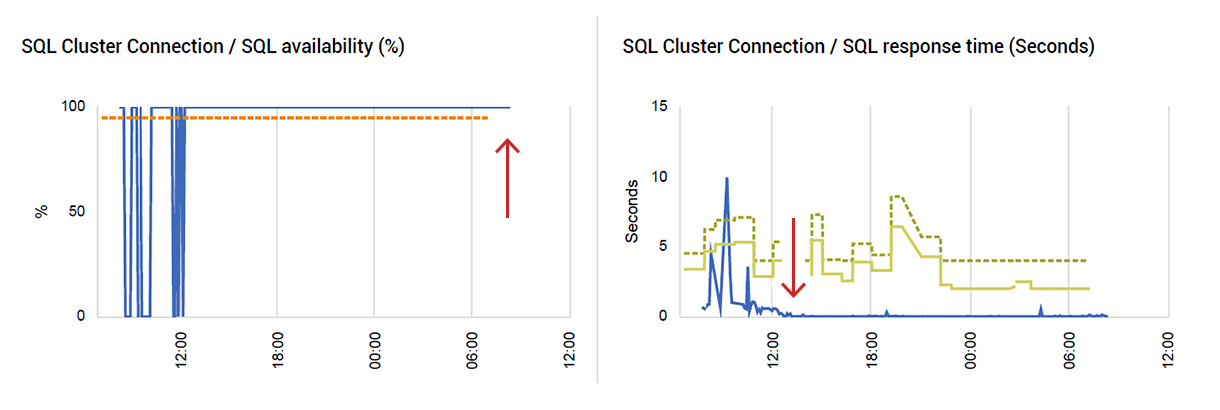
After our change, you can see from Figure 9 that response times for accessing the SQL database cluster decreased significantly. There were also fewer SQL connection problems as seen by SQL availability remaining at 100%.
Improvements were seen in the web application’s availability as well. Notice from Figure 10 that there have been no application availability drops after the JDBC driver modification discussed above. The number of simultaneous database connections used also dropped significantly and this directly resulted in a drop in CPU utilization of the application’s JVM – see Figure 11.

End-to-End Monitoring: A Must for Effectively Resolving Performance Issues
The real-world example I have covered in this blog highlights the challenges in diagnosing and resolving performance issues with multi-tier applications.
| The slowdown in this example resulted from an inefficiency in the JDBC database driver, an inconspicuous component in the application architecture. Yet, the impact of this inconspicuous component on application performance was huge. |
Modern applications make use of many third-party libraries, drivers, modules, public domain components, and so on. As we saw in our example, inefficiencies in any of these components can greatly impact application performance. Pinpointing the application component that is responsible for a problem is a key to addressing the problem. To effectively monitor and troubleshoot application performance issues, it is important that every component of the application delivery chain must be monitored and performance anomalies highlighted.
We have shown how monitoring several key parameters and thread-level insights were important in identifying the problem in the example we provided. Application transaction tracing for Java, Microsoft .NET, and PHP applications can also provide great insights into any code-level, database, or third party component bottlenecks that impact application performance.
eG Enterprise includes extensive monitoring capabilities for more than 200+ application technologies and a large number of underlying infrastructure platforms. To view a complete list of supported platforms, see https://www.eginnovations.com/product/technologies
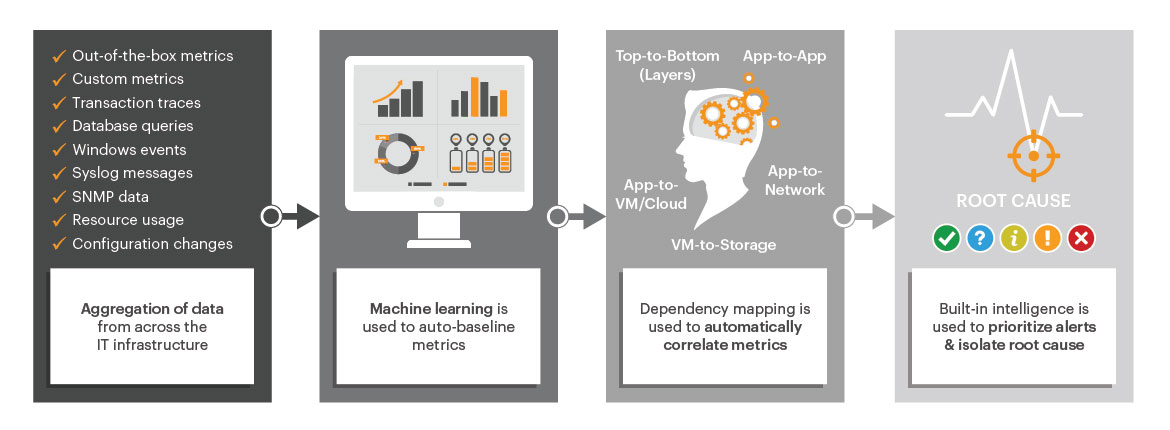
Figure 12 highlights how eG Enterprise works. Performance metrics are collected using different means. From logs, from WMI, from performance counters, using APIs, etc. These metrics are analyzed and any performance anomalies are flagged. An AIOps engine analyzes the anomalies from each tier of the application delivery chain and correlates between these anomalies to determine where the root-cause of the problem lies. Intelligent and automated diagnosis makes it possible for even help desk staff to effectively triage problems and get the right domain experts involved. Doing so reduces the mean time to repair (MTTR) and enhances application availability and user satisfaction.
eG Enterprise is an Observability solution for Modern IT. Monitor digital workspaces,
web applications, SaaS services, cloud and containers from a single pane of glass.
For More Information:
- Download our comprehensive survey on APM usage trends and data from: Application Performance Monitoring in the New Normal | eG Innovations
- Download our AIOps Solutions & Strategies eBook now
- If you enjoyed this Postmortem blog post – you may enjoy this similar one, Troubleshooting Web Application Performance & SSL Issues
- An overview of Java Performance Monitoring Tools, which enable you to prioritize problems automatically and provide actionable notifications
- How to Troubleshoot Java CPU Usage Issues: Troubleshoot Java CPU Usage | JVM High CPU Threads
- Top 10 Java Performance Problems – An in-depth guide to the most common Java issues and identifying them
- Monitoring SSL Certificates in Business-Critical Applications (eginnovations.com)
- AIOps Tools – 8 Proactive Monitoring Tips | eG Innovations
