

We’ve been busy with eG Innovations at several customer sites for Proof of Concepts or troubleshooting. With all the implementations we gather more data and have access to more and more interesting screenshots that show you why eG Enterprise is a great end to end monitoring tool.
End to End Monitoring Tool – Proof of Concept
So last week we setup a new proof of concept for a system center customer that manages a big number of customers of their own.
First let’s take a look at the components that we configured to be monitored, we monitor 10 Citrix servers streamed with Provisioning services. The servers are monitored with an agent installed, an agent gives more information then agent-less.
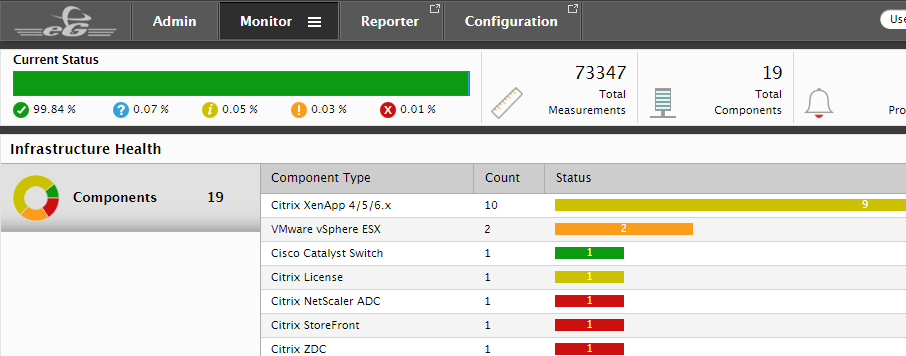
Two vSphere hosts are monitored with all virtual machine on them, the License server, Zone Data Collector, Netscaler and StoreFront so that we have a full view of the Citrix environment. We added a Catalyst and a firewall to the list and started the monitor on monday, two days ago. Within a few minutes data was flowing in and after two days we get a nice view of the environment and it’s issues.
StoreFront
First thing to look at was the StoreFront server, I noticed it was showing a red color so something was wrong there. The customer told me already that they only had one running at this moment and the second one was to be added in a few days.
It seems that two services aren’t running as they should, I haven’t yet figured out how and why but perhaps it’s due to StoreFront running on one leg. 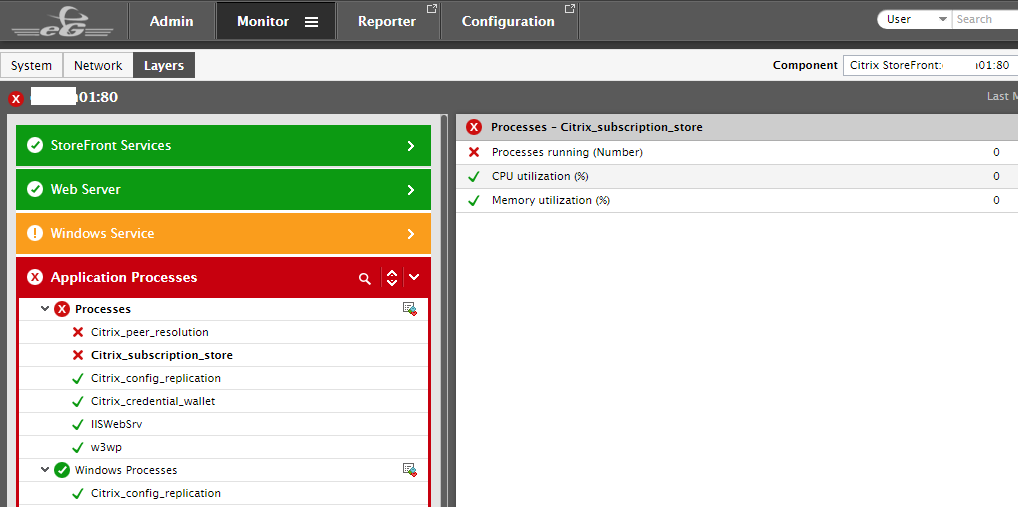
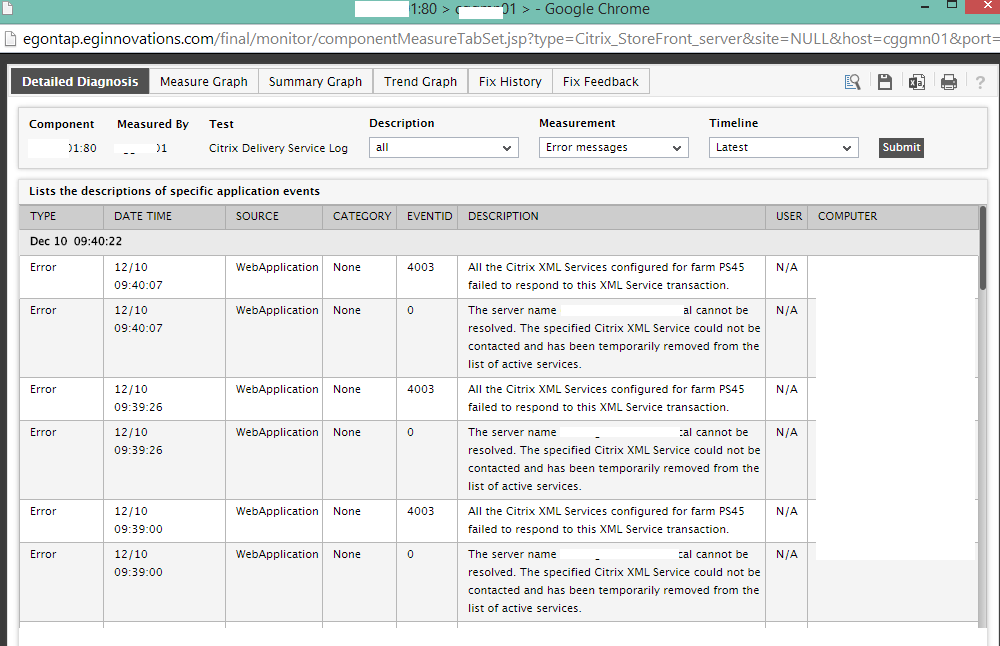
Because of the application processes reporting issues, the layer above it shows a color so I checked if they were related. The Windows Service layer is reporting a lot of error messages so let’s open that one.
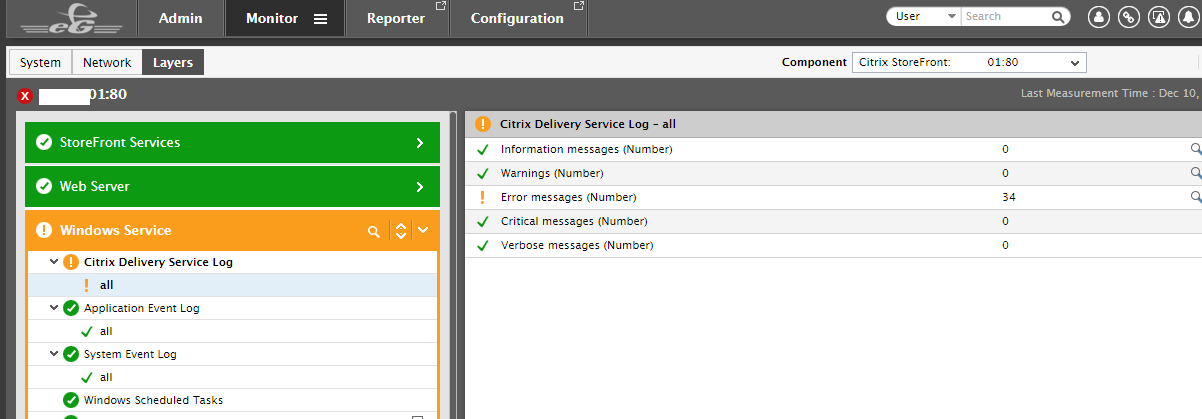
As you can see it fairly easy to dive into the server and see what is happening there. No need to connect to the server to look at the eventlogs, eG can handle that from one console just fine.
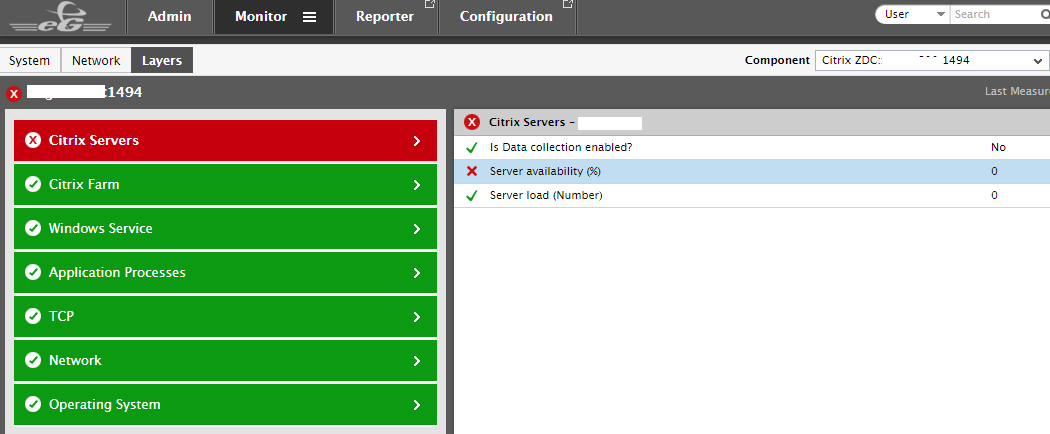
Data collector
The next server to look at was the data collector was it was also showing a red color. it says that there is an issue with server availability. Let’s take a closer look.
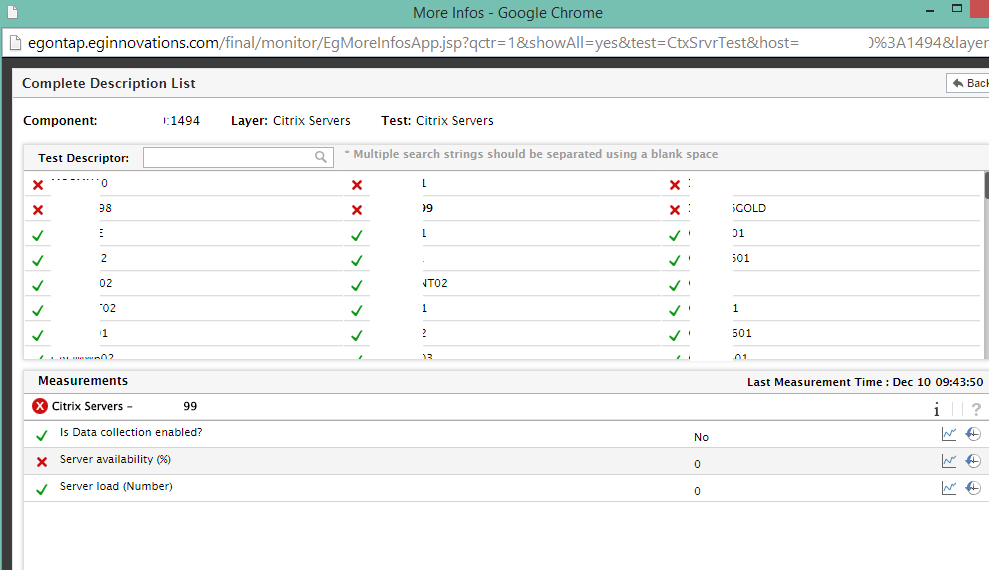
I had to wipe out all the server names for their customer won’t like it if they are mentioned here I guess. What we noticed was that six servers were listed there that are not present anymore in the Citrix farm. So somehow the data collector is getting info from somewhere that these server should be there. This is currently being investigated for that is not what you want. To be clear, the six servers in red are orphan Citrix servers of a long lost past 😉
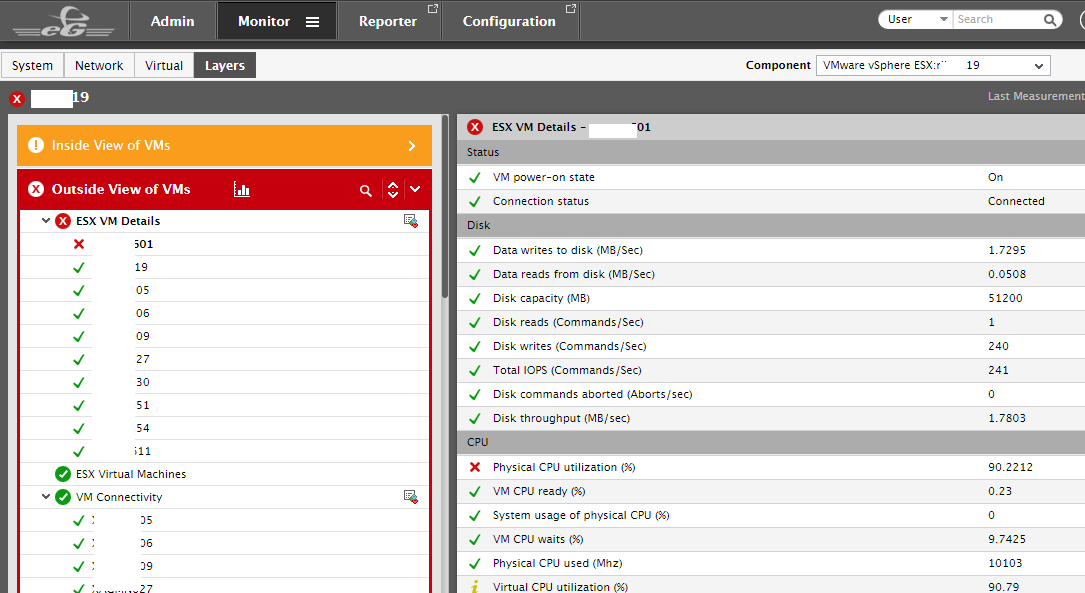
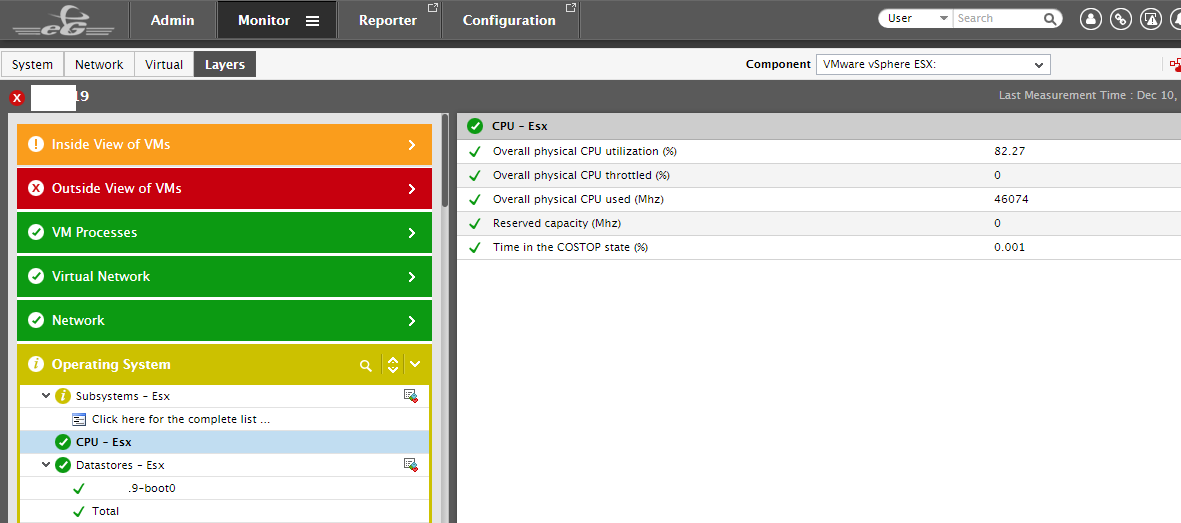
ESX
So let’s move on to the ESX host and see what is monitored there. A very nice way of monitoring is that you can have a look from the outside and from the inside of the virtual machine. So what is the impression Windows has it is experiencing and what is reality.
Here you can see that one virtual machine is claiming 90% CPU time on its own, that’s pretty much and will impact the others if it lasts to long.
As we looked that the graph it shows this VM does this every day so perhaps it’s worth looking at what it’s doing.
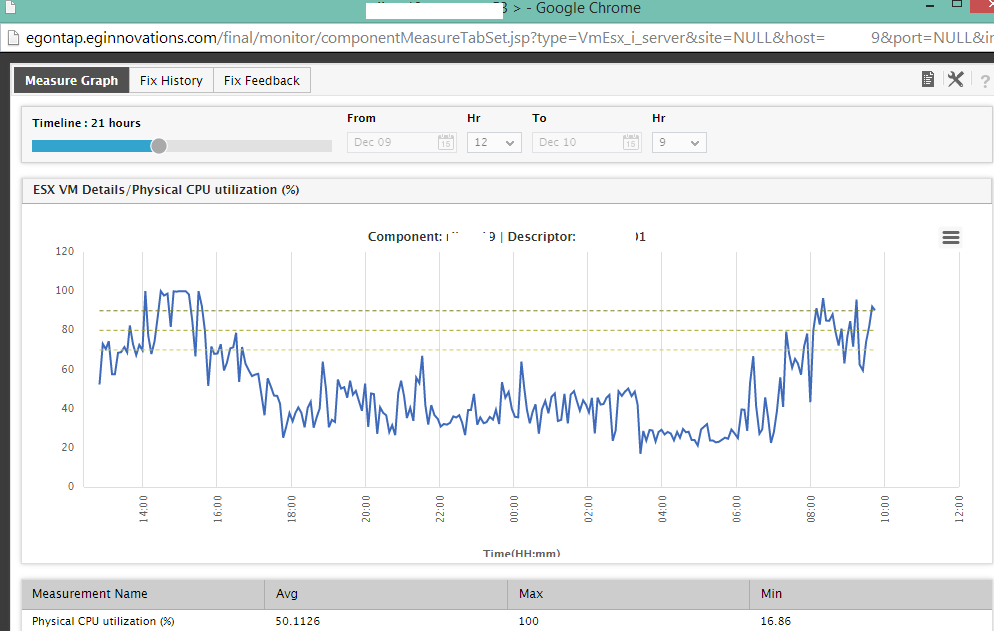
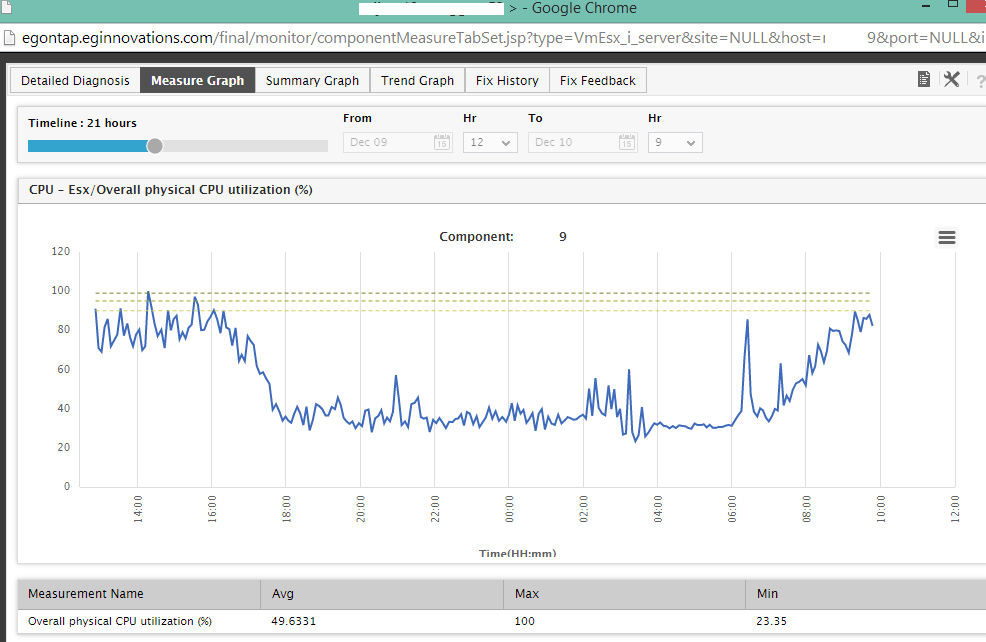
So I checked if the overall CPU performance of the ESX host was impacted by this. I looked at the graph for the CPU performance.
The overall CPU performance of the host was not too bad but comes close to 90% often, perhaps some reorganizing is needed here. Again under investigation with the customer, they have some homework to do.
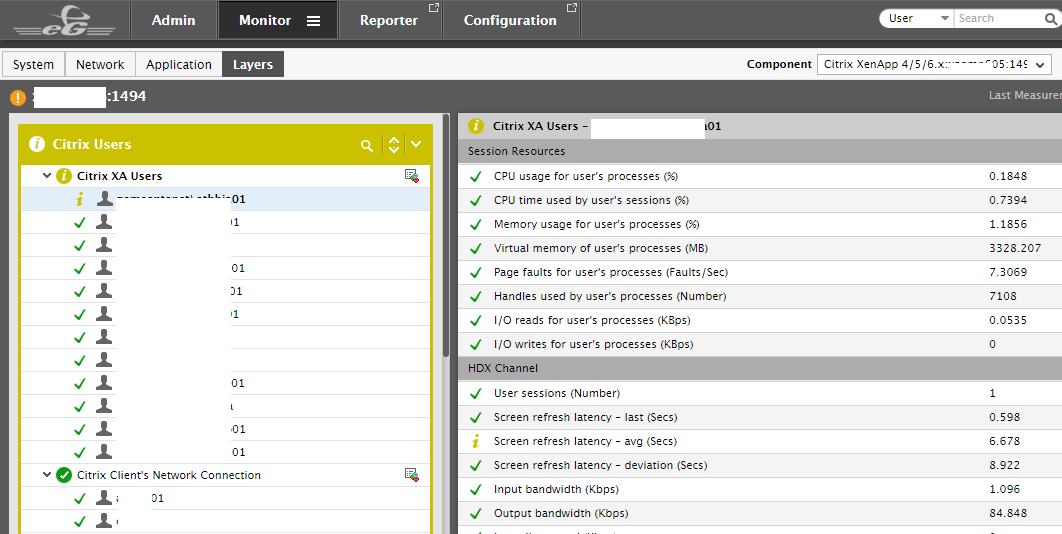
Citrix Servers
Of course the Citrix servers have to be checked also and I noted that one user was having a minor issue. The rest of the sessions seem to be running just fine, we use Cache-to-Ram there to provide enough performance.
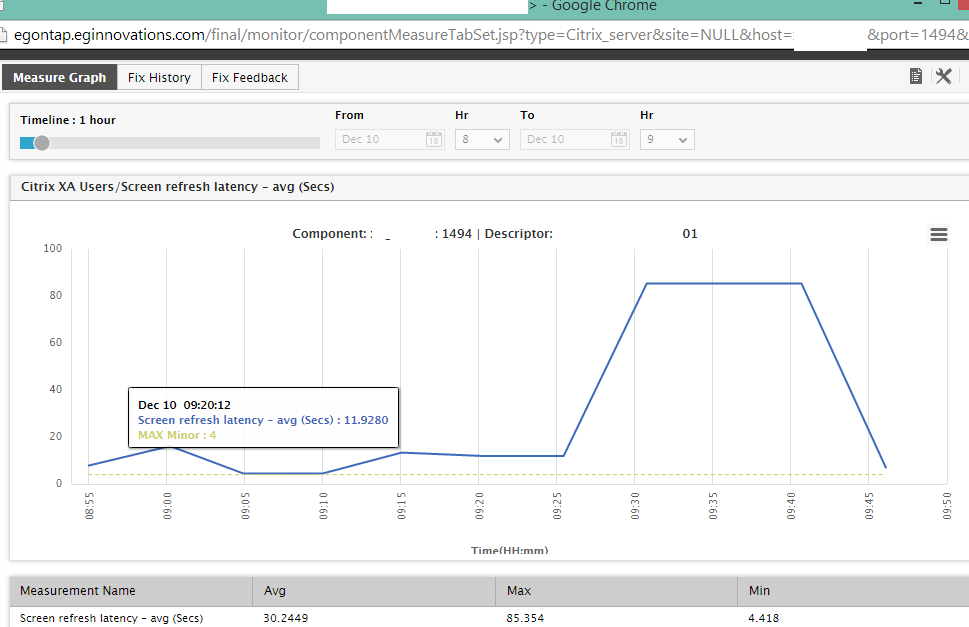
The user had a screen refresh latency of 6 seconds, 6 seconds is that long that you can draw your screen yourself… checked with the other users and they had 0.009 latency or something like that.
Looking at the graph for this user it seems like a glitch as it went up and down fast. These graphs are very useful for service desks for they give instant information about the users session.
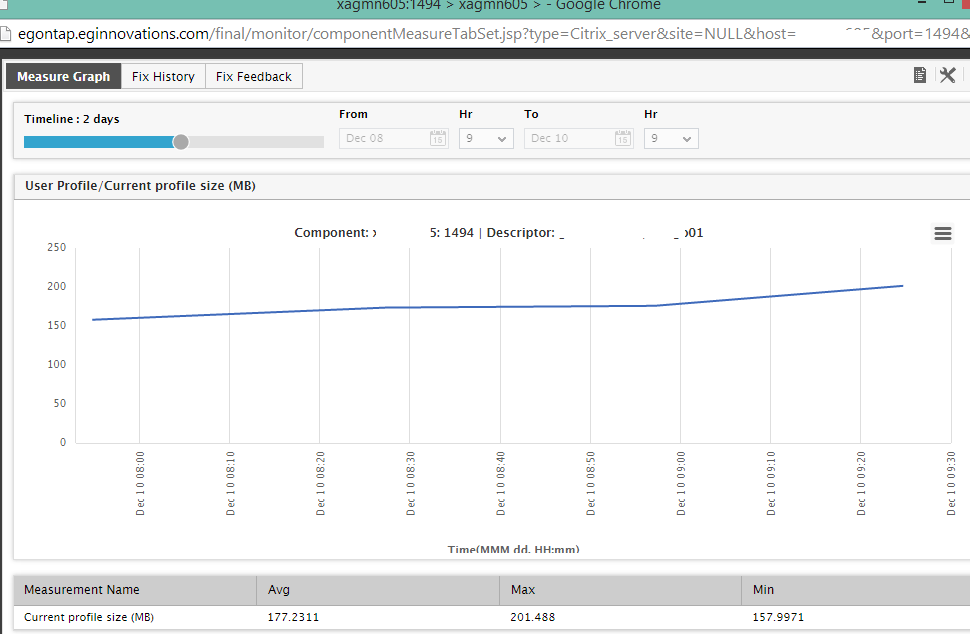
Another thing it monitors is the profile size of the user, the customer still uses Roaming profiles (what??? yes they know and are going to change). The user has a profile size of 200MB and it is growing as Roaming profiles grow. There are more users there with this large profiles so they know they need a UEM solution to fix this… work in progress.
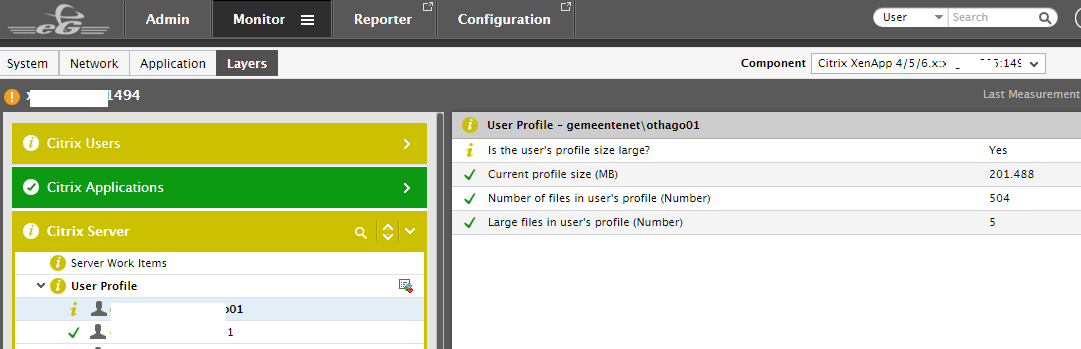
We only monitored two days but already we can see the growth in the profile for this user, going up by the hour. that’s why you need a decent UEM solution.
Overall health
I did a check on the Citrix servers and took a look at the overall dashboards. What you can see instantly is the number of disconnected sessions, hung sessions and that kind of information. I think this screen is far more informative that what Citrix is offering these days. 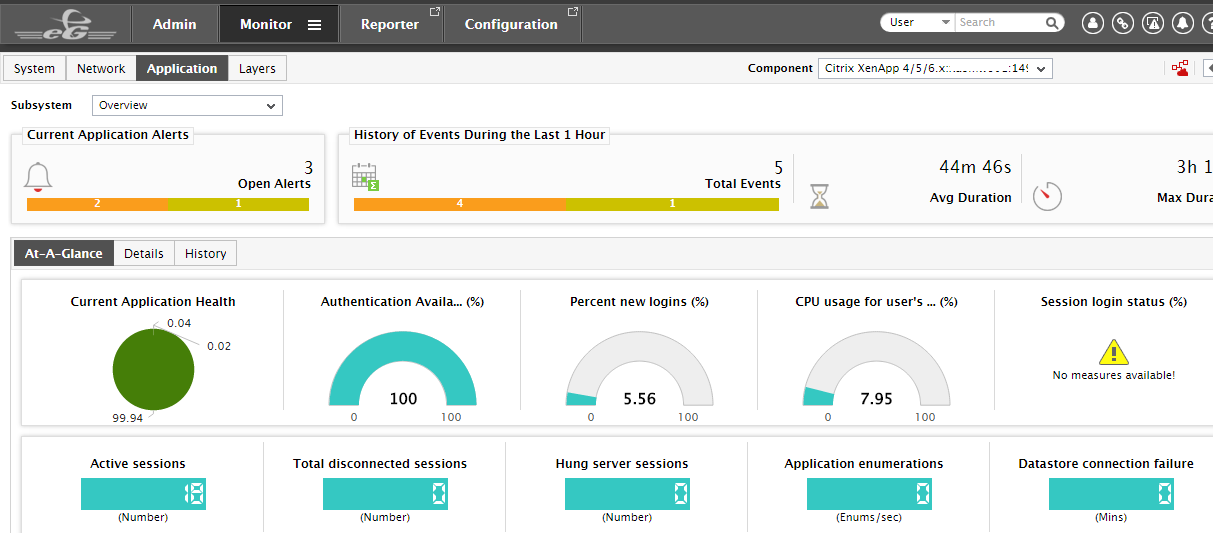
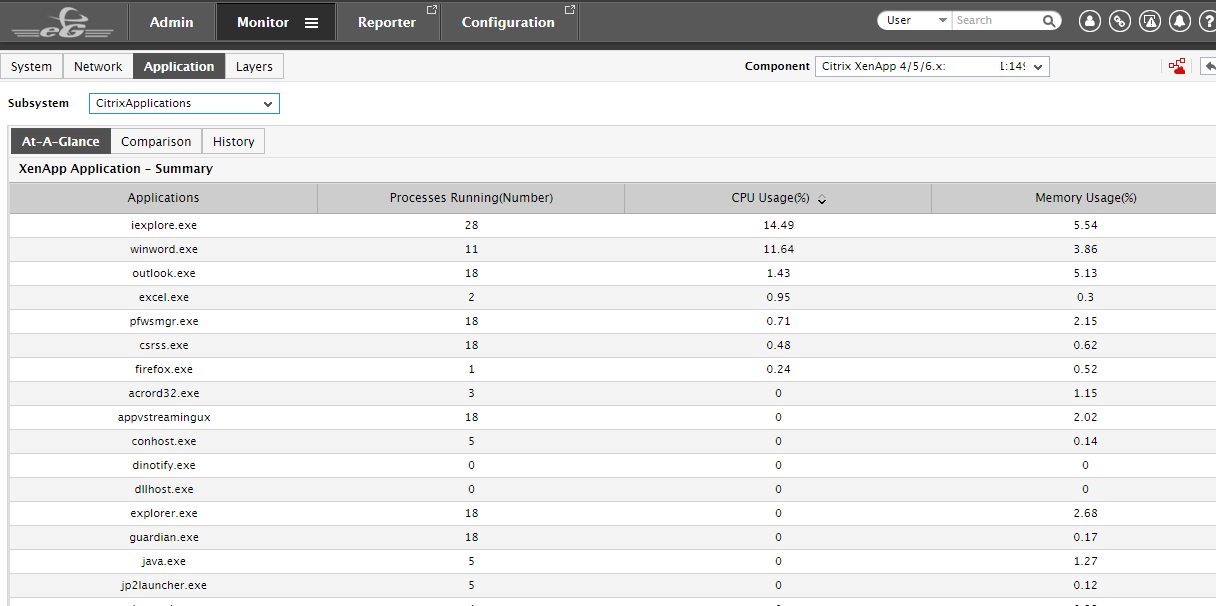
Also on the application side of things you can see the number of instances being used on that server and the CPU usage of the application. This customer had issues with Winword.exe being aggressive on CPU and they wanted to know who was using it at that time. With all the tools they had now they had no way getting that data, now they can.
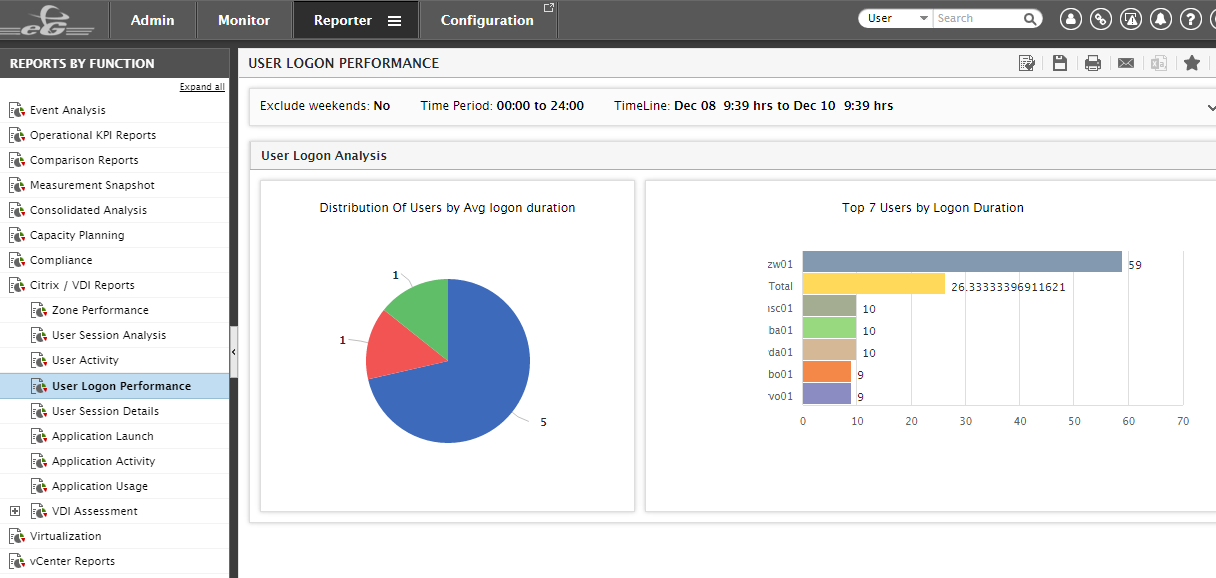
A report asked from many customers within Citrix environment is about logon performance. With eG there is a report for that, it shows the logon duration for the users. these reports are customizable so that they will show what you are looking for. I chose the default TOP7 one to show that it monitors logon times. Citrix has a nice break down of this itselfs which I like a lot.
I hope this gives a good impression of the possibilities to monitor and why you should. When you want data of how your environment is running and you want it correlated in one console look at products like eG Innovations.
I written about monitoring before and as mentioned in the beginning there are others. Depending on your needs you have to choose the correct one. Contact me or PQR if you are searching for the right one, sure we have a product that will help you out. Read our case study showing how our IT network support and performance monitoring system improved user satisfaction and reduced IT support incidents »
[This post was published in Rob Beekmans excellent blog vThoughts of IT]
eG Enterprise is an Observability solution for Modern IT. Monitor digital workspaces,
web applications, SaaS services, cloud and containers from a single pane of glass.
