How to Troubleshoot Multi-cloud Applications using Modern Observability
Multi-cloud and hybrid cloud applications are deployed on multiple cloud vendor platforms, including on-premises private cloud. While these platforms offer tremendous benefits by providing a reliable and scalable platform for fuelling digital transformation, they also add significant monitoring complexity.
Site reliability engineers (SRE) need multicloud monitoring visibility to:
- Pinpoint the root-cause of slowness or errors to the specific microservice deployed on the cloud vendor’s platform.
- Not waste time in other microservices (deployed on other cloud vendors or on-premises) that may experience cascading side-effects.
Why is this important? SREs face several challenges in multicloud and hybrid cloud environments:
- Complex, connected and cascading failures: Multicloud applications are complex. Applications are made up of connected microservices distributed across multiple clouds. A single problem can trigger a number of cascading side-effects, potentially triggering a large number of alarms.
- Tools that don’t talk to each other: While each cloud vendor provides their own monitoring solution, none of these tools speak to each other. This could lead to each of the cloud-native monitoring solutions to show a “red” status, thereby causing confusion on true root-cause.
- Where to start?: SREs have difficulty knowing where to begin problem diagnosis in multicloud environments.
Our recent State of APM survey results found that 40% of SREs, DevOps and IT teams were using four or more APM tools to try and isolate the root-cause of performance problems.
In this article, you’ll learn how a modern approach to observability that uses AI-assistance to connect the dots across multiple clouds can give you actionable insights to remediate and resolve the problem quickly.
Troubleshooting a Multicloud Issue in Three Clicks
I’m going to take a microservices based e-commerce application that is deployed on a combination of on-premises, AWS and Azure. I’ll walk you through a troubleshooting workflow that requires only three clicks to pinpoint the root-cause of the problem.
Three clicks is a useful heuristic for SREs to optimize the MTTR – Mean Time to Resolution, Repair, Respond. A good way to keep MTTR low is by consolidating observability signals (code-level traces, service dependencies, change events, metrics, logs) and automatically pinpointing the root-cause so that SREs can quickly diagnose and engage the right teams to remediate the issue.
Microservices Based Technology Stack
In terms of the technology stack, it would be very familiar to anyone working on applications and microservices in a multicloud environment. The application uses a “polyglot” approach with multiple languages, frameworks deployed on containers and multiple clouds (AWS and Azure).

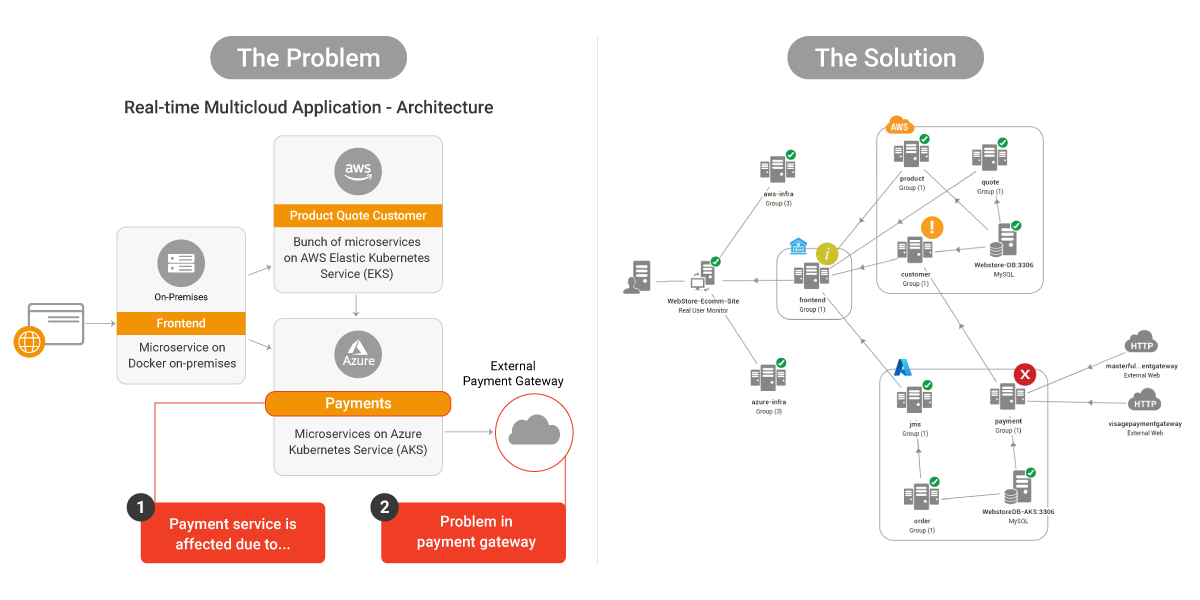
Problem Statement – Troubleshooting an E-Commerce Application
The e-commerce application is decomposed into microservices that are deployed on different hosting services. The front-end is hosted on-premises, the product inventory and customer database are hosted on AWS and the checkout and payments service are hosted on Azure.
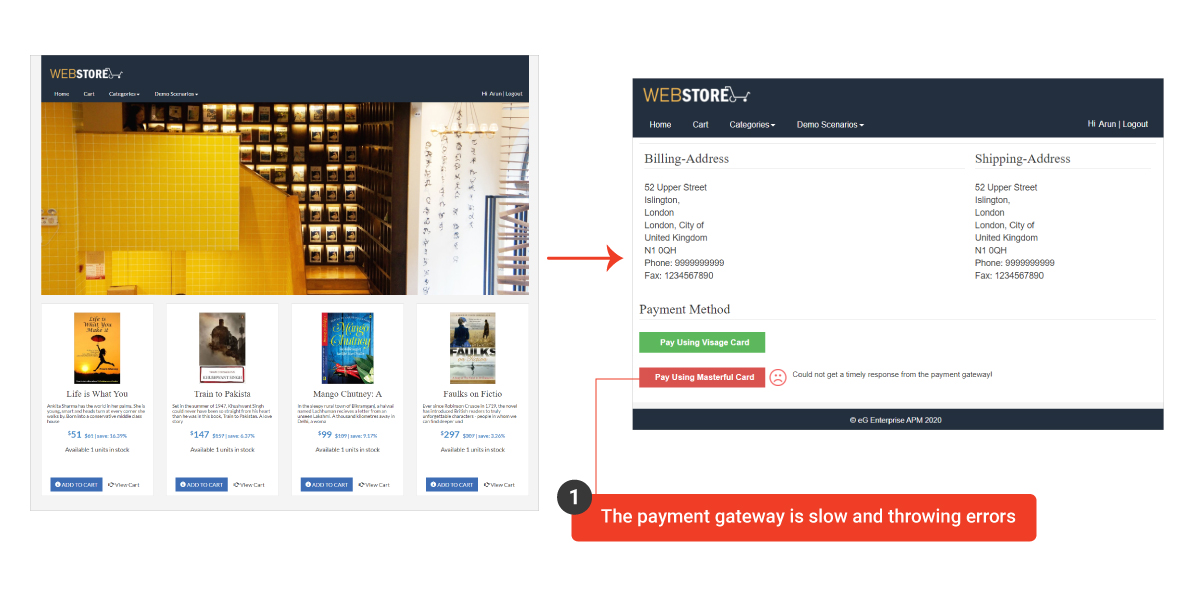
It is also reliant on an external payment gateway to process the payments of customers that checkout on its store.
One of the external payment gateway service is slow and throwing errors. Users get a error message as shown below and user complaints are flooding the call center.
Drawbacks of using Cloud-native Monitoring Solutions
The SRE teams were erstwhile using cloud native monitoring tools supplied by the cloud vendor. In this case it was AWS CloudWatch for the AWS components and Azure Monitor for the Azure components.
Since the microservices have a dependency with each other, failures cascaded across the application. Additionally, none of these tools speak to each other, so each cloud-native monitoring solution showed a “red” state—signaling that there was a problem with the microservice hosted on that cloud.

Since the payments microservice on Azure experienced failures, the depending microservice on AWS also failed. However, since AWS CloudWatch has no knowledge of Azure, the SREs were unable to pinpoint the root-cause of the problem.
They ended up in a war room with administrators of all the services looking at their dashboards and chaos ensued. Hence, the need for a single pane of glass, multicloud monitoring solution.
Solution – Troubleshooting Multicloud Apps in Three Clicks
A full stack monitoring tool has the ability to automatically detect components and determine the inter-dependencies between them. One of the complaints against Azure Monitor and AWS CloudWatch is that they require a lot of manual setup and lots of tedious data entry work as you manually set thresholds.
eG Enterprise does all of that for you automatically, with built-in vendor-recommended thresholds. The result is a topology map that lays out your multicloud environment in an easy-to-read graphical interface.
This screenshot closely resembles the architectural diagram that we saw above, with the added microservices shown within the cloud provider’s groups along with the inter-dependencies of those microservices.
The SRE teams typically have this dynamic and real-time topology dashboard projected on a large TV screen continuously monitoring the health of the multicloud application.
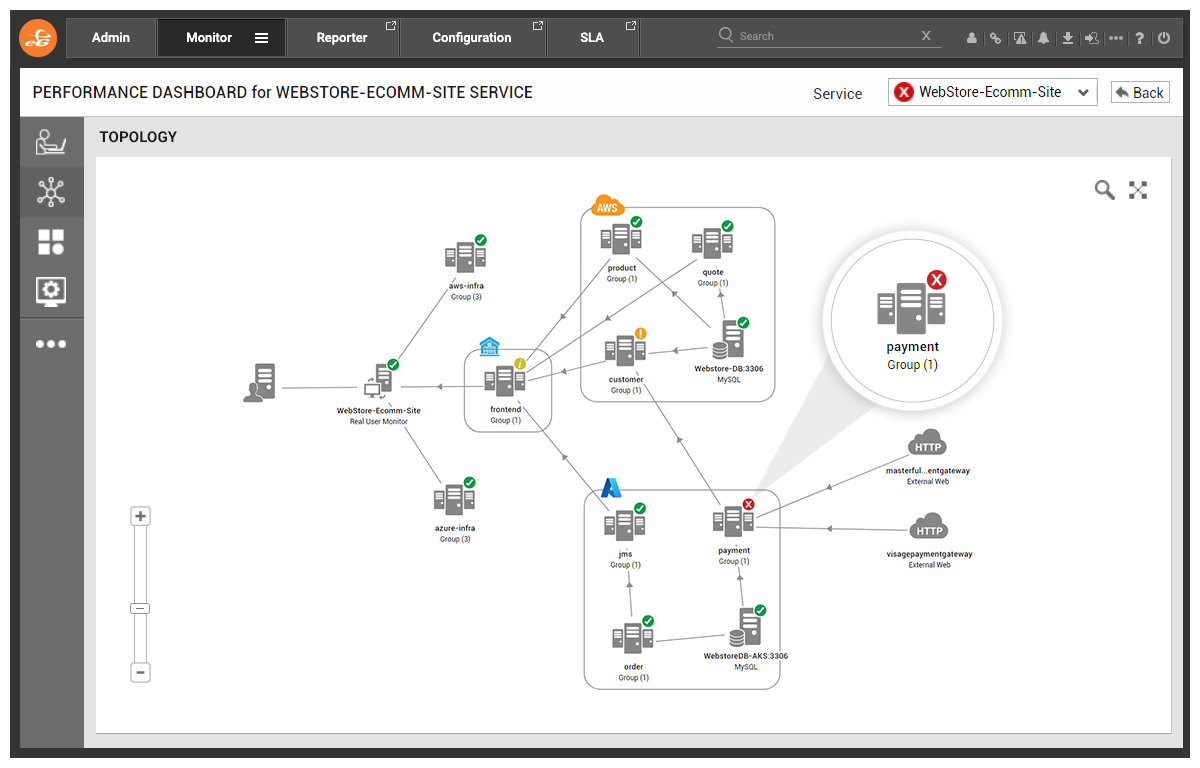
In the screenshot below, we can see that there is a critical alert on the Payment service within Azure as indicated by the red color. eG Enterprise has identified this as the likely root-cause of the problem which is having a knock-on effect on dependent services – i.e. customer microservice on AWS and the frontend microservice on the on-premises environment.
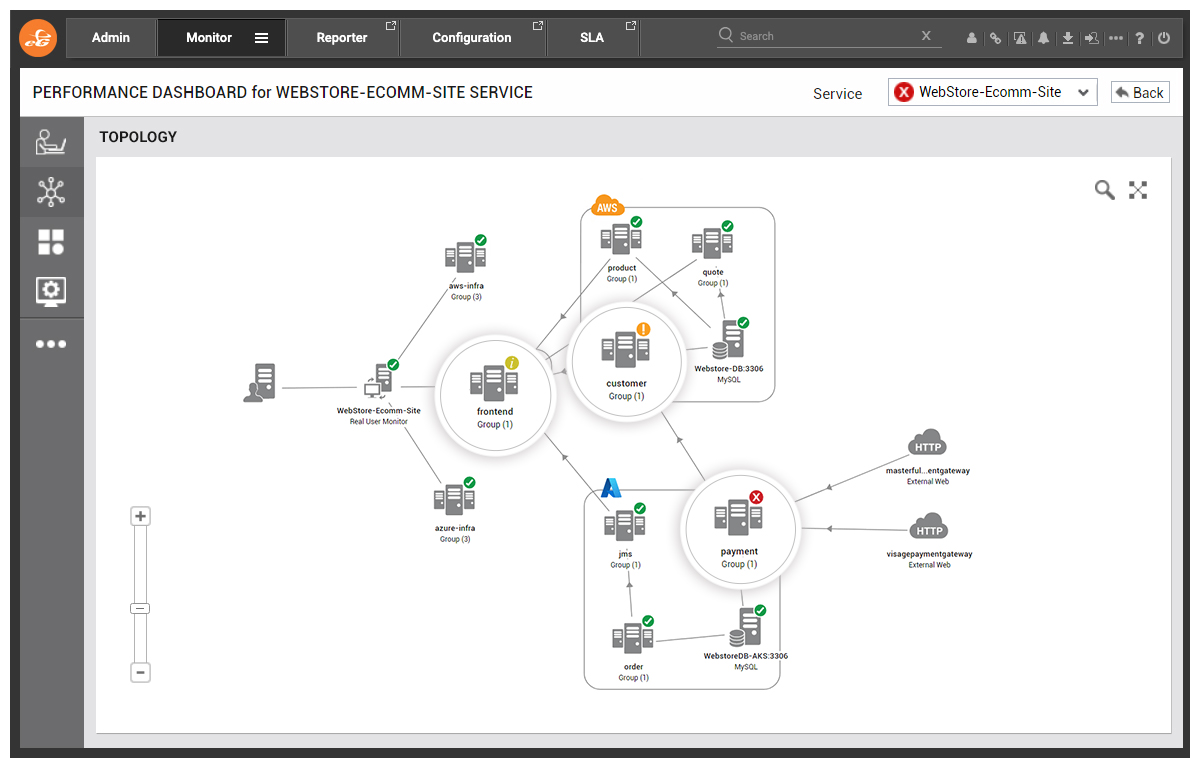
The Payment microservice relies on external payment gateways in order to function properly. We need to determine whether the fault is within our own microservice or if there’s a problem with the external payment gateway.
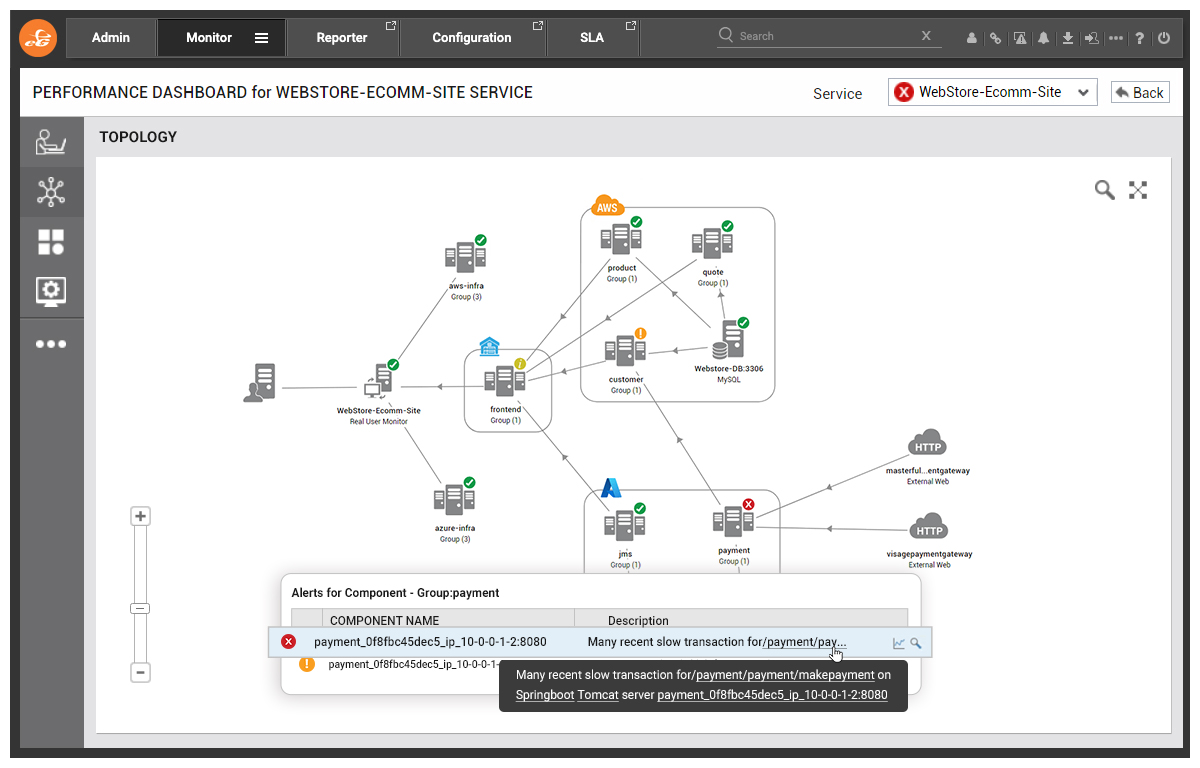
Click #1: List of Problems for the Selected Microservice
Clicking on the red alert icon brings up an automatic contextual description of the problem that eG Enterprise has discovered. In this case: “Many recent slow transactions for payments” which is exactly the experience our customers are having on the front end with payment failed error messages.
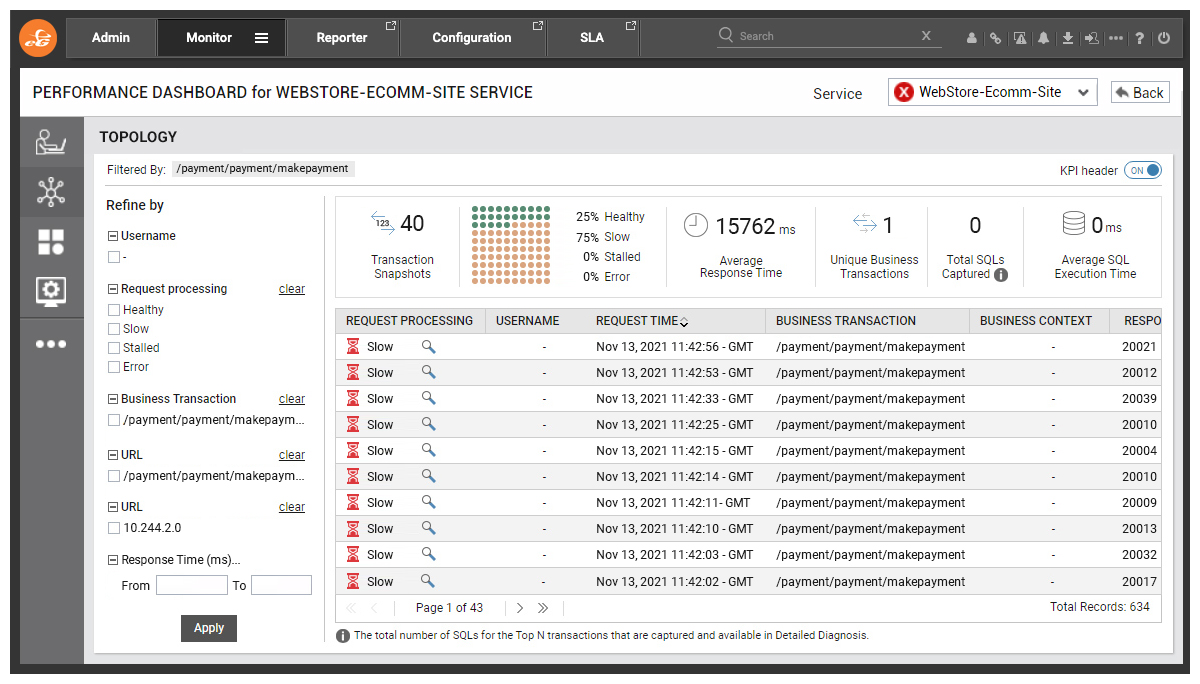
Click #2: Drill-down into Set of Transactions Exhibiting the Problem
Clicking on the magnifying glass icon brings you to a deeper level of analysis for Business Transaction Monitoring, or what we call Slice and Dice analytics. Every action a user takes on the e-commerce website is captured by eG Enterprise and we can drill down into an individual transaction to see what is going on.
Click #3: Pinpoint the root-cause down to the Code-level
Diving into an individual transaction, we get a diagram visualizing the data journey through the application. You can see that eG Enterprise has automatically detected the technology – in this case, Java running on SpringBoot based on Tomcat.
Everything looks fine between the user and the front-end, and the front-end and the payment service. However, there is a 20 second delay between the payment gateway on Azure and the payment gateway API. I think we have found our root-cause of the problem!
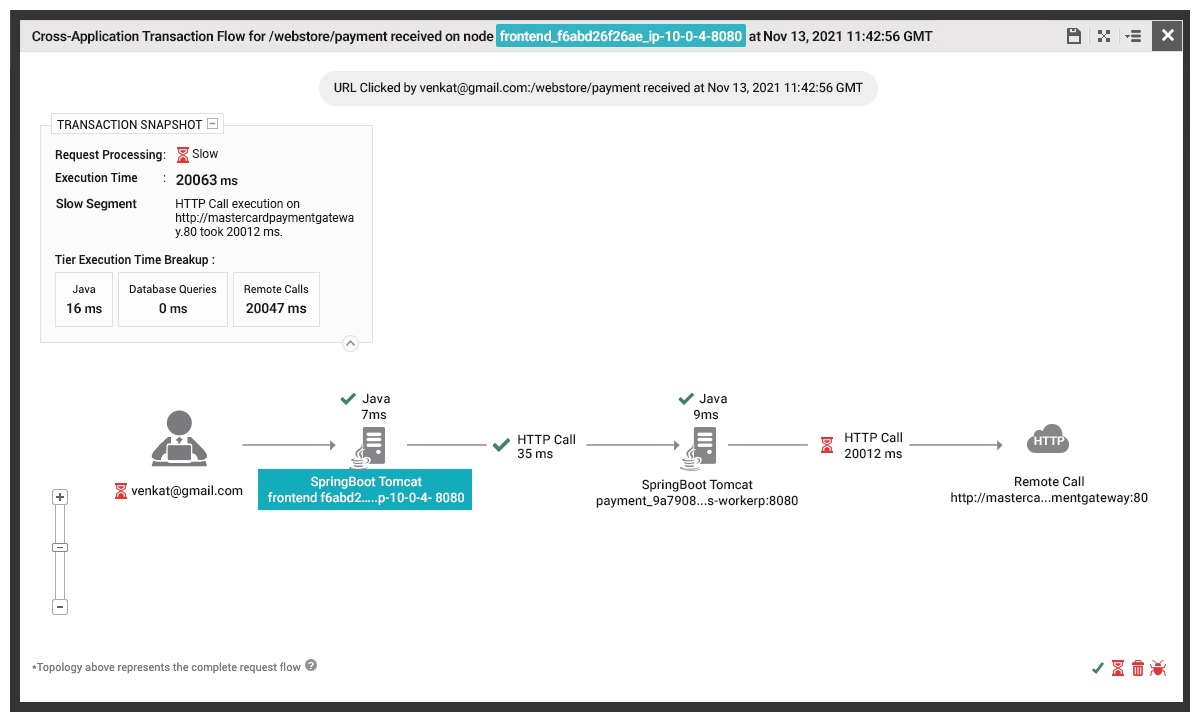
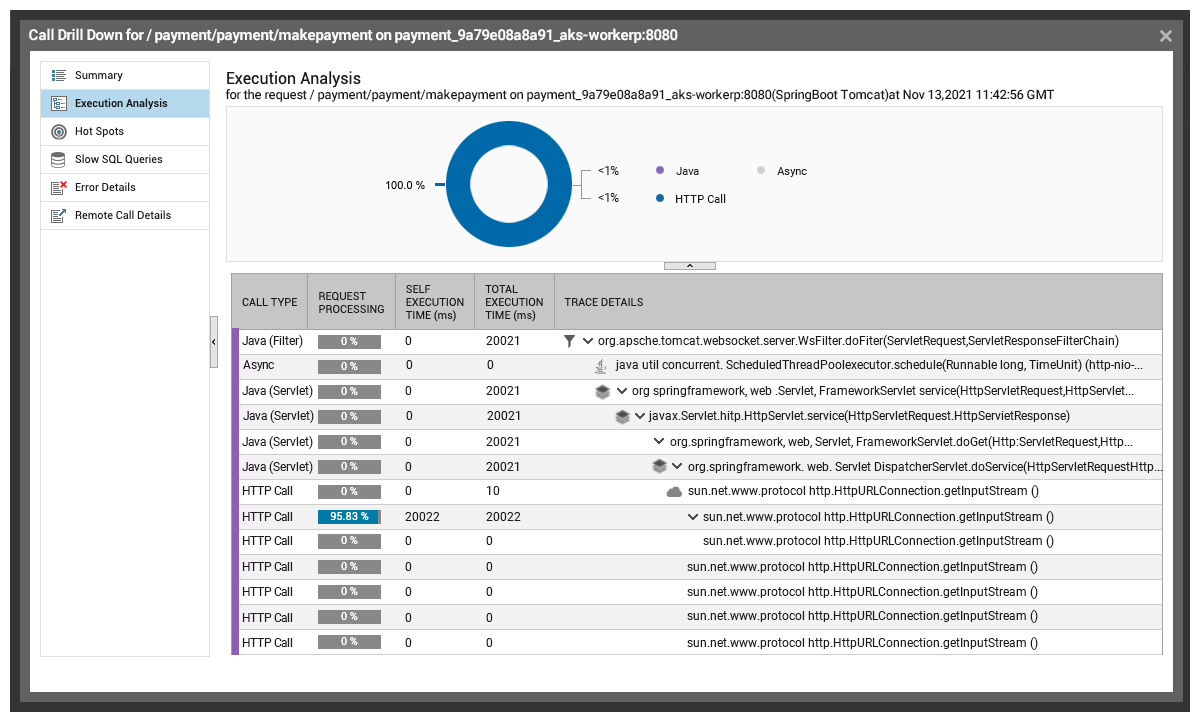
We can even do a further execution analysis at the code level to further confirm that it is the API call to the external payment gateway that’s causing the problem. This screenshot shows a trace of all the HTTP calls and the response time for each execution.
What is a Topology or Service Map and What are its Benefits?
In the troubleshooting flow that I have described above, the starting point was a topology diagram – also known as a “service map”. SREs need a real-time visual representation of the application’s dynamic architecture.
Key benefits of the observability benefits that topology or service map offer:
- Understand connections in distributed microservices architecture : SREs can visualize the relationships between microservices. The upstream services can give context on what the impact of latency or errors are on the end user. This helps SREs prioritize and triage issues, focusing on what’s critical.
- Automatically created and updated: A topology automatically discovers and updates new microservices dependencies. Developers might sometimes inject new dependencies (such as a third-party API) and because of a gap in documentation, a new service dependency might come as a (sometimes nasty) surprise for the SRE. With a topology dashboard, SREs can spot unintended dependencies rightaway.
- Rich observability context: Topology provides rich context of traffic, latency and errors on top of arrows that connect one microservice to another.
- Zoom into details: Clicking on the arrow or the microservice can take you to the exact line-of-code that causes slowness or error. You can pinpoint exactly where in the execution flow, there’s an anomaly in latency or errors.
Many cloud monitoring tools offer just charts and graphs where you have to do the debugging heavy lifting. The value of a microservice architecture-aware observability tool is incredible and can drastically reduce the mean-time-to-resolve.
Avoid Unnecessary War Rooms with Multicloud Monitoring
There’s no need for war rooms in this scenario. eG Enterprise has made multicloud monitoring very simple. The only action to take is to submit a support ticket to the payment gateway provider – and maybe pull up the contract with them that mentions uptime SLAs!
How to Choose the Right Multicloud Monitoring and Root-cause Diagnosis Tool
While cloud-native monitoring tools claim to do correlation and root-cause diagnosis, you should be aware of a few key distinguishing factors:
- Merely showing state color on a bunch of related applications and network devices is not correlation. True correlation involves analyzing the dependencies and sub-components to identify where the cause of a problem lies.
- Suppression of events from multiple sources based on thresholds is also not correlation.
- Tools that force you to manually and visually correlate based on data from different data points will lead to a time consuming and laborious diagnostic process.
- Tools that require rule-based correlation require you to build elaborate if-then-else conditions. In a dynamic and ever-changing environment such as cloud and containers, this is not an option. Moreover, you might require expert knowledge and many months of consulting hours. If your infrastructure were to change ever so slightly, you will need to re-architect the correlation rules.
Look for tools that:
- Automate the correlation and diagnostic process.
- Correlate across layers and tiers of the microservices application (e.g., if the network is down and application is not reachable, then the network error must e given higher priority over application error).
- Are non-expert friendly. IT organizations are under-staffed and SRE teams are asked to do more with less. At a minimum, even if the helpdesk operator cannot solve the problem, they should be able to identify the right expert to be involved in the troubleshooting process.
- Don’t require a separate license for auto-correlation from the base product.
With the troubleshooting flow outlined above, anyone can immediately identify in which tier and layer any performance problem might be. It helps to eliminate finger-pointing because often when IT teams work in silos they look at their own dashboard (for example, AWS CloudWatch) and declare that everything is fine for them so go and look for the problem elsewhere.
SRE Dashboards for Multicloud Health Monitoring
We looked at a troubleshooting workflow above for a specific problem scenario. Several themes stand out in what we have seen so far:
- Full stack monitoring tools can give you a clear understanding of business impact. This helps you to triage and prioritize problems that matter the most (and defer those that don’t).
- You need a clear separation of root-cause vs symptoms or side-effects.
- Even non-experts (such as helpdesk or L1 support) can effectively triage performance problems if the dashboards provide clear color-coded insight into root-cause.
- Transaction-level visibility at each dependent microservice tier enables effective fault isolation. SREs can collaborate with development teams to solve problems.
Even when there are no active incidents, SREs need a bird’s-eye view visibility into all cloud services across end-user experience, applications and infrastructure.
eG Enterprise offers the ability to see the status of all your cloud services side by side on a single screen.
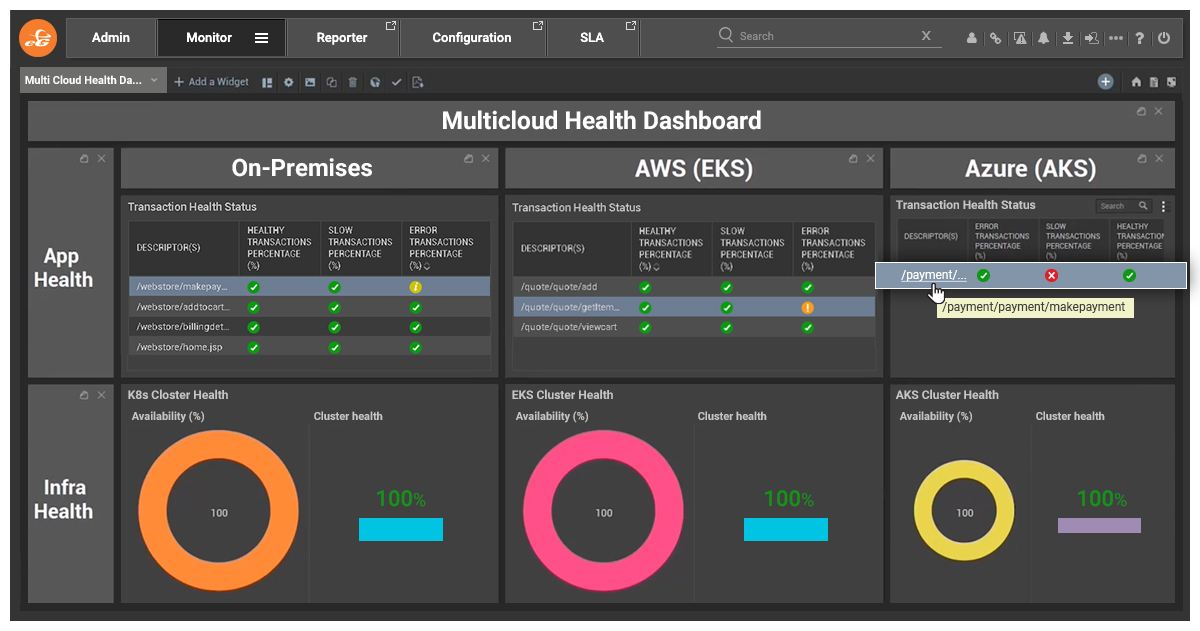
These dashboards are pre-made in eG Enterprise and are just one of hundreds of pre-built dashboards. You also have the option to build customized monitoring dashboards using an intuitive drag-and-drop interface to show the metrics that are relevant to your multicloud environment.
When you project these dashboards showing metrics from all cloud services onto the TV screen then you’re bringing about a cultural change within the organization. You’re bringing in system administrators, devops, developers, site reliability engineers and getting them all on the same page and looking at the same metrics.

Conclusion – Three Clicks is All it takes to Resolve Performance Problems (If you have the Right Observability Tool)
The process I showed you above took three clicks to go from the multicloud topology to identifying the root-cause of the problem. The amount of time saved to detect the problem and resolve the problem means the business won’t be losing out on thousands of dollars due to the downtime.
If there was a traditional siloed approach to the scenario outlined above, all the infrastructure admins will declare that there is nothing wrong with the services because everything is running as normal. A war room would be declared, and everyone would be pointing fingers to where the problem lies.
DevOps, and SRE teams are in a race to keep pace with the rapidly expanding complexity of modern cloud ecosystems. SREs need the right observability tool to:
- Detect outages, software malfunctions, and degradations in service levels.
- Live dashboards and historical reports to analyze the health of the system by measuring demand, resource consumption and quality.
- Visualize microservice dependencies and understand how dependent microservices might impact each other.
- Observability is all about unearthing the “unknown unknowns”. To that end, SREs need the slice-and-dice capabilities to observe patterns that have never occurred in the past.
- Proactive capacity planning – Identify long-term trends for capacity planning and business objectives.
Start your Multicloud Monitoring Journey
If you are looking to monitor complex multicloud environments, take a look at eG Enterprise. It supports over 200 technologies out of the box and is fully compatible to monitor microservices running in Docker containers and Kubernetes pods.
Get full visibility into your multicloud environment with a 30 day free trial.
eG Enterprise is an Observability solution for Modern IT. Monitor digital workspaces,
web applications, SaaS services, cloud and containers from a single pane of glass.
 Arun is Head of Products, Container & Cloud Performance Monitoring at eG Innovations. Over a 20+ year career, Arun has worked in roles including development, architecture and ops across multiple verticals such as banking, e-commerce and telco. An early adopter of APM products since the mid 2000s, his focus has predominantly been on performance tuning and monitoring of large-scale distributed applications.