When your application is slow, you might need to prove that the cause of the slowness orginates within the application and not within the network. To do this you need an application performance monitoring tool that can correlate between application performance and the underlying IT infrastructure to identify the root-cause.
Part of the problem with troubleshooting application slowness is that so many IT teams still use network monitoring tools because that’s usually been the easiest thing to monitor and the easiest to troubleshoot. Modern applications require teams to monitor both the network and the application.
Network Monitoring is Not Sufficient
 The one complaint that a network administrator dreads receiving is one where an end user says, “My application is slow!”. The application in question can be a web application, an enterprise application like SAP, Microsoft SharePoint, or a SaaS application like Salesforce or Office 365.
Since the application is accessed over a network, it’s natural that the network team is pulled up first under the suspicion that it’s a network issue – maybe a slow network connection, bandwidth shortage, dropped packets, performance issue in a router/switch, and so on. 
After checking their network monitoring systems and the health of all the network devices and the links exhaustively, the network team may pass the problem on to the application and infrastructure team to see if the issue is in their respective domains.
Since all the different administration teams in an organization use different tool sets, the famous war room scenario often plays out. Each team provides data to argue their case that the problem is not in their domain.
War room meetings last several hours, and problem resolution takes even longer. In the end, user experience suffers and so does business productivity. In this blog, we will cover monitoring technologies that go well beyond basic network monitoring and can help administrators clearly highlight where the root-cause of application slowness lies.
Troubleshooting Application Slowness is Challenging
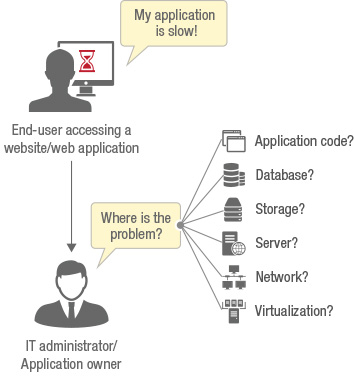 Regardless of which team gets the call first, the challenge is to be able to diagnose the source of the problem and fix it. Diagnosing a problem can be time consuming for many reasons.
- Many organizations use dozens of monitoring tools – one for each tier – e.g., network monitoring tools, database monitoring tools, virtualization monitoring tools, desktop monitoring tools, application monitoring tools and so on. Manual analysis of these tools takes time.
- Irrespective of how many tools an organization has, there are always gaps. And it’s these gaps that cause diagnosis to be lengthy. The biggest gap today is lack of insight into the real user experience. IT teams are still focused on resources in the infrastructure.
- At the same time, the number of dependencies in an IT infrastructure have increased many folds over the years. Most modern applications are multi-tiered and there are tight inter-dependencies between tiers – for example, a slowness in the database tier will affect the response time on the web tier. The adoption of virtualization and cloud technologies has only increased the number of dependencies. And with microservices and containers gaining traction, these dependencies are set to become dynamic.
All of these make diagnosing application slowness issues very challenging!
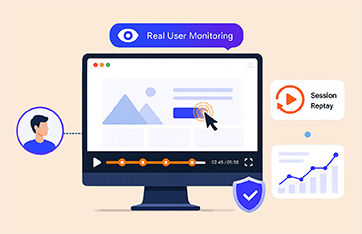
Real User Monitoring: Bridging the Gap between IT and Users
Real user monitoring (RUM) is a technique that is embedded in modern application performance monitoring tools. This technology allows IT teams to track the experience they are delivering to users. At the same time, real user monitoring tools have the intelligence to help isolate which domain may be causing slowness – is it the browser, or the network, or the server-side, or the content download? This information is crucial for enabling faster diagnosis of slow application problems.
The network team can use these insights to prove that it’s not the network that is responsible for a slow application!
While there are many ways to monitor the real user experience, a popular way of implementing real user monitoring is using JavaScript injection for web applications. This technique is very similar to how Google Analytics is implemented for web site visitor tracking. With RUM, a small JavaScript snippet is added to the web application’s content. This snippet is downloaded by client browsers and reports page load time and other details about application performance back to the monitoring tool.
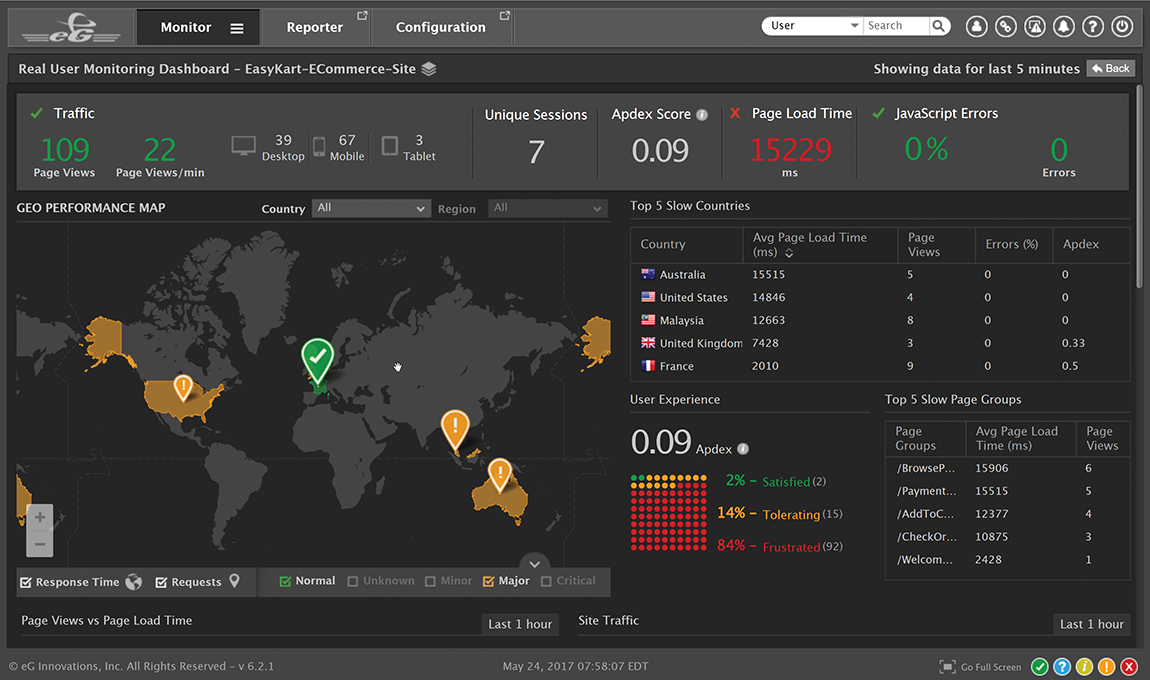
The figure above shows the real user experience for a web application. From this dashboard, one can see that Page Load Time for this application is higher than 15 seconds. According to an online study, if a website or a web application loads in 5 seconds, it is faster than approximately 25% of the sites on the Internet. If it’s an e-commerce site, the page load time expectation is even higher – 2 seconds. The User Experience panel towards the bottom of the dashboard above shows that 82% of users of this web application are frustrated. The geographic map indicates that users from most geographies are affected. This is a clue that the issue is not specific to a geography.
Using resource timing API, for every request that violates the response time threshold, RUM provides insights into processing time at the browser, network, server and downloading content. In the example below, we can see that most of the page load processing is happening on the server-side (while the user saw a 30 second page load time, 25 seconds was spent on the server-side), indicating that it’s a server-side issue which the application/systems team needs to address. This confirms that the web application slowness is not due to a network problem. By tracking the network response time (TCP handshake) and the application/server response time (time to first byte), RUM can easily pinpoint where to go for troubleshooting.
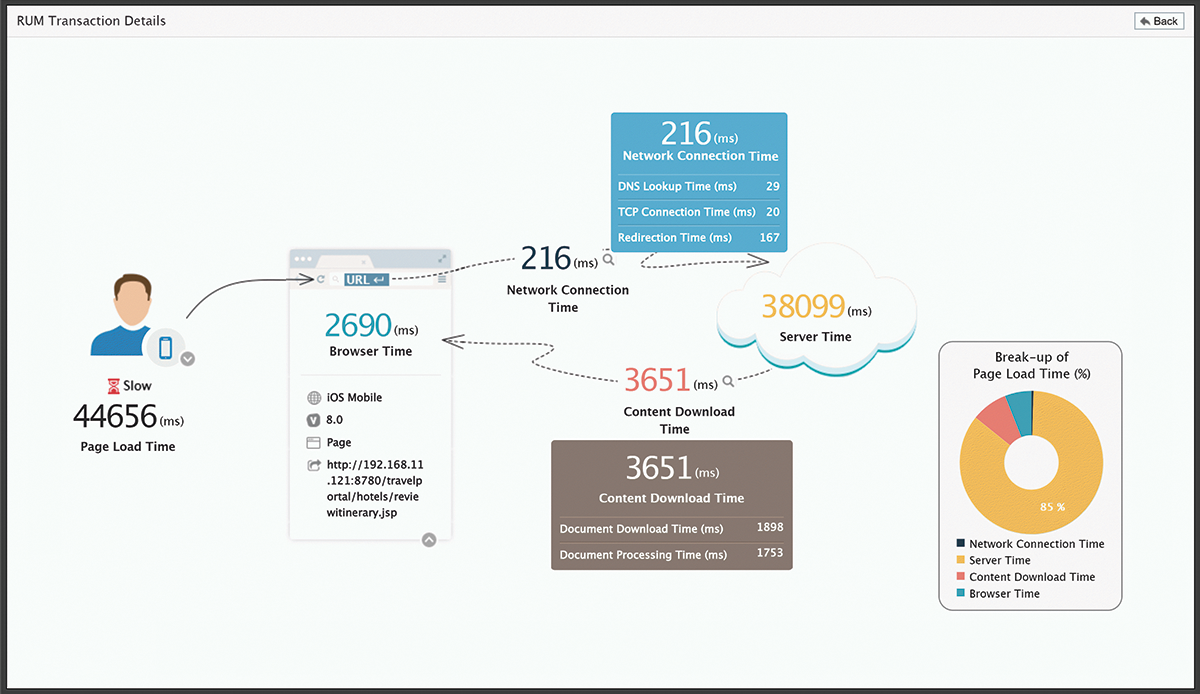
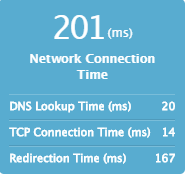 If it indeed was a network issue, then the network connection time would have been the highest contributor to the total response time. RUM further breaks down the network connection time into DNS lookup time, TCP connection time and redirection time to isolate the network issue more accurately.
Implementing RUM in an infrastructure is straightforward. Most common web servers – Microsoft IIS, NGINX, Apache, etc. – allow administrators to inject JavaScript snippets without requiring any changes to the application code. Automatic injection of JavaScript snippets can also be done at the load balancer level. Citrix NetScaler/ADC and F5 BIG-IP provide configuration options for such injection. So, the application team need not even be involved.
Going Beyond Real User Monitoring for Troubleshooting Application Slowness
As we have seen, RUM can give insights into where the cause of slowness might lie. For deeper diagnostics, you may need additional monitoring capabilities for networks, applications and servers. The eG Enterprise solution from eG Innovations provides in-depth monitors for every layer and every tier of an IT infrastructure. IT managers can use the solution as a single pane of glass – so they can monitor the performance of their infrastructure end-to-end in one console.
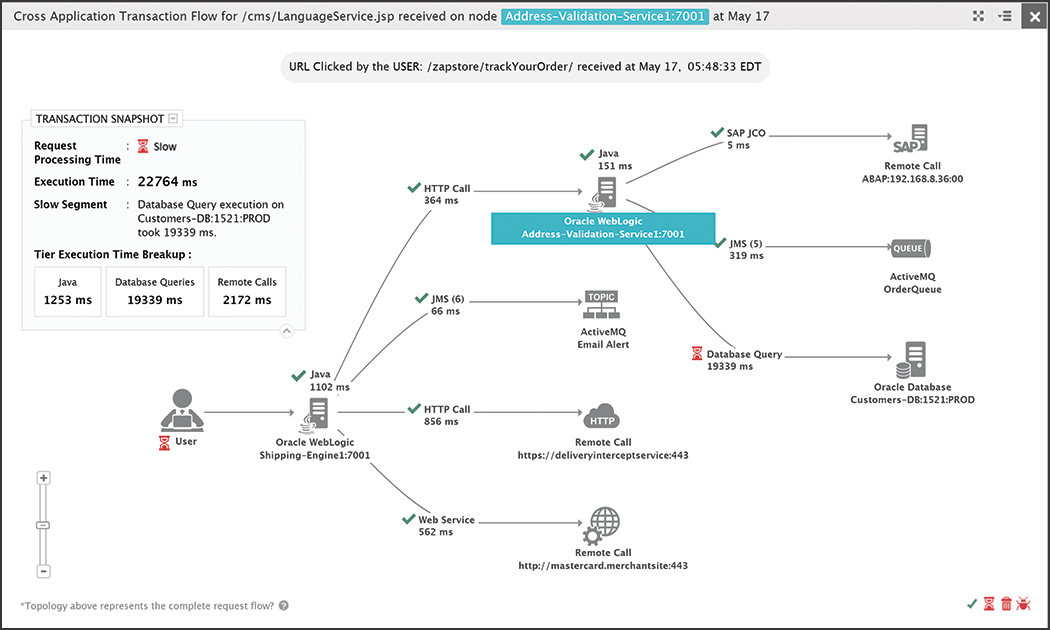
- Color-coded application topology views provide additional insights to help IT managers diagnose further: for example, is the slowness due to an application code issue, or an inefficient query, or a slow HTTP call to a remote web service, or whether it is due to the virtualization platform or storage.
- Synthetic monitoring is also supported so IT managers can set up software robots that simulate application access from multiple locations in the network, even from different geographies.
- All the varied capabilities of eG Enterprise are intended to provide IT managers with just the insights they need to diagnose and fix the toughest IT problem of today: “Why is my application slow?”
eG Enterprise is an Observability solution for Modern IT. Monitor digital workspaces,
web applications, SaaS services, cloud and containers from a single pane of glass.