As an application owner or architect, have you been in situations where the users complain that the Web Application is slow, but there is no clear root cause?
How do we go from finger-pointing and hit-and-miss troubleshooting to pin-pointing the root cause?
This blog post frames the problem statement and outlines two key challenges that you need to tackle and resolve. Stay tuned as we dive into potential solutions in future blog posts.
.
A typical “It’s Slow” Scenario
The other day, I was talking to an IT Director of a leading multi-national bank, who explained his monitoring challenges which you may be able to relate to.
You’ve been in these situations before. Why is pinpointing root cause in a multi-tier Web Application such a pain?
There are several reasons – but it all boils down to this: Lack of holistic and coherent end-to-end performance monitoring and management perspective. I’ve outlined a flavor of the key challenges which we’ll explore in-depth in future blog posts.
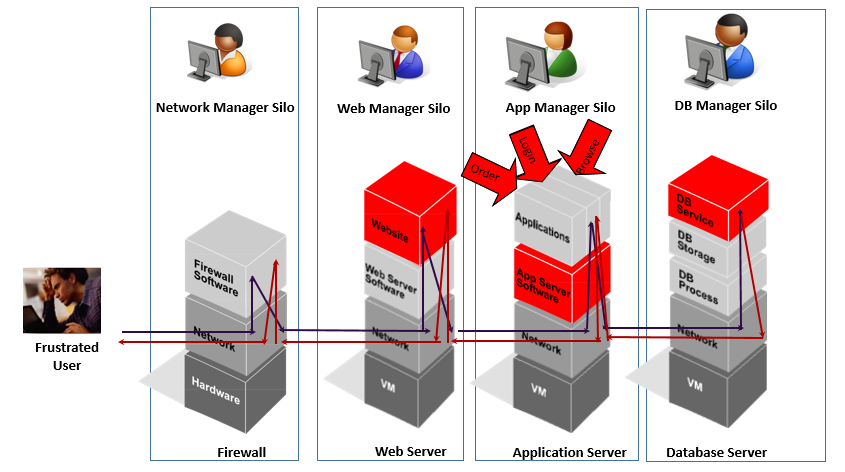
Challenge #1: Symptoms Everywhere, Root Cause Nowhere
Most application performance management and monitoring is silo-based. When performance problems occur, each siloed team looks at point products in their own domain.
In a multi-tier application, there are complex inter-dependencies. There is a ripple effect of problems that cascade across tiers. Teams get caught up in troubleshooting the symptoms without understanding where the root-cause lies. Often, this leads to long troubleshooting cycles and increases the Mean Time To Repair (MTTR).
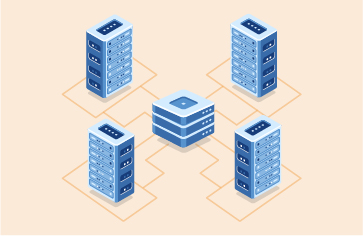
Multi-tier applications have complex inter-dependencies.
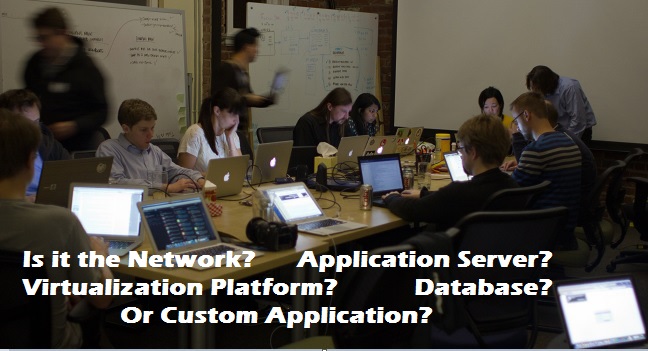
Can you quickly pinpoint root cause from a variety of symptoms?
Challenge #2: “Ain’t My Problem” syndrome
Sometimes, the exact opposite happens. Each silo team lives in their island with their own tool-sets:
- DBAs have database analysis tools
- Network admins have packet sniffers, probes and protocol analyzers
- Web server admins have web server log mining tools
- Middleware admins have console applications such as Weblogic, WebSphere or JBoss console (assuming this is a java web application).
- Application support teams have to trawl through tons of spaghetti custom logs
Each of the above teams have a narrow view of the system since there is little or no coordination across these siloed toolsets. This results in a lack of an integrated view of the system.
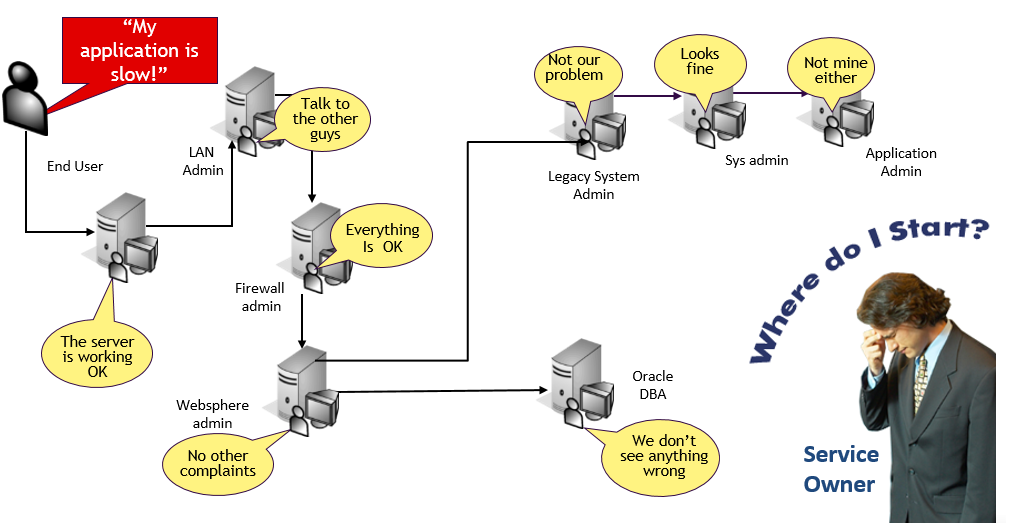
Multi-tier triage is hard because of the independent and siloed toolsets
No solution in sight

How do we go from Silo Management to True Service Management?
You need a single pane of glass that not only pinpoints root cause but also significantly reduces the MTTR.
The results include: Better service quality, satisfied users, productive IT staff, and lower operations costs, all of which can ensure great ROI from service management.
Watch for the next post in this series!
Learn more about IT monitoring solutions from eG Innovations.
 About the Author
 Arun is Head of Products, Container & Cloud Performance Monitoring at eG Innovations. Over a 20+ year career, Arun has worked in roles including development, architecture and ops across multiple verticals such as banking, e-commerce and telco. An early adopter of APM products since the mid 2000s, his focus has predominantly been on performance tuning and monitoring of large-scale distributed applications.