Storage Adapters Test
The Virtual I/O Server provides virtual storage and shared Ethernet capability to client logical partitions on the system. It is installed in its own logical partition, and allows physical adapters with attached disks on the Virtual I/O Server to be shared by one or more client partitions.
Using this test, you can periodically monitor the I/O activity on each of the physical adapters and attached disks supported by the Virtual I/O server.
Target of the test : An IBM pSeries server
Agent deploying the test : A remote agent
Outputs of the test : One set of results for each physical adapter supported by the VIO server on the IBM pSeries server being monitored.
| Parameter | Description |
|---|---|
|
Test period |
How often should the test be executed |
|
Host |
The IP address of the host for which this test is to be configured. |
|
Port |
Indicate the port at which the specified Host listens. By default, this is NULL. |
|
Real ServerName |
Specify the name of the pSeries server in the Real ServerName text box. If the target pSeries server has been auto-discovered using HMC, the server name will be set automatically in the Real ServerName text box. However, while configuring this test for a pSeries server that has been manually added, you have to explicitly provide the server name in the Real ServerName text box. Note: To obtain the real server name, a user can login to the target pSeries server as a valid pSeries user, go to the shell prompt of the server, and execute the following command: lssyscfg - r sys -F name |
|
Is Managed By |
By selecting an option from the Is Managed By list, indicate whether the target pSeries server is managed using an HMC server or an IVM (Integrated Virtual Manager) server. If the target server has been auto-discovered via an HMC server, the HMC option will be automatically chosen from this list. |
|
Management Server, Management User, Management Password |
This test connects to an HMC/IVM server to perform LPAR discovery and to collect host-level and "outside view" metrics from the pSeries server. To enable this communication, first, provide the IP address/host name of the HMC/IVM server in the Management Server text box. If the eG manager had automatically discovered the target pSeries server by connecting to an HMC server in the environment, then, the IP address/host name and user credentials pertaining to that HMC server will be automatically displayed in the Management Server, Management User, and Management Password text boxes. However, if the pSeries server being monitored was manually added to the eG Enterprise system (and not auto-discovered via the HMC server), then, you will have to explicitly indicate whether the target pSeries server is managed by an HMC server or an IVM server by selecting an option from the Is Managed By list. If the HMC option is chosen, then, you will have to provide the IP address of the HMC server that manages the target pSeries server in the Management Server text box. In such a case, in the Management User and Management Password text boxes, you will have to provide the credentials of an HMC user who is assigned the hmcviewer role. On the other hand, if the IVM option is chosen from the Is Managed By list, it implies that the IP address/host name and user credentials pertaining to that IVM server has to be explicitly provided in the Management Server, Management User, and Management Password text boxes. |
|
Confirm Password |
Confirm the HMC Password by retyping it here |
|
Domain |
Set the Domain parameter to none. |
|
Admin User, Admin Password, Confirm Password |
The eG agent remotely communicates with each discovered LPAR on the pSeries server to obtain their "inside view". For this, the eG agent will have to be configured with the credentials of a valid user with access rights to each LPAR. If a single user is authorized to access all the LPARs on the pSeries server, provide the name and password of the user in the Admin User and Admin Password text boxes, and confirm the password by retyping it in the Confirm Password text box. On the other hand, if the test needs to communicate with different LPARs using different user accounts, then, multiple user names and passwords will have to be provided. To help administrators provide these multiple user details quickly and easily, the eG administrative interface embeds a special configuration page. To know how to use this page, refer to Configuring Users for LPAR Monitoring. |
|
SSL |
By default, the HMC/IVM server (as the case may be) is not SSL-enabled. This indicates that by default, the eG agent communicates with the HMC/IVM server using HTTP. Accordingly, the SSL flag is set to No by default. If you configure the HMC/IVM server to use SSL, then make sure that the SSL flag is set to Yes, so that the eG agent communicates with the HMC/IVM server using HTTPS. |
|
Ignore VMs Inside View |
Administrators of some high security LPAR environments might not have permissions to internally monitor one/more LPARs. The eG agent can be configured to not obtain the 'inside view' of such ‘inaccessible’ VMs using the Ignore VMs Inside View parameter. Against this parameter, you can provide a comma-separated list of LPAR names, or LPAR name patterns, for which the inside view need not be obtained. For instance, your Ignore VMs Inside View specification can be: *lp,aixlp*,lin*. Here, the * (asterisk) is used to denote leading and trailing spaces (as the case may be). By default, this parameter is set to none indicating that the eG agent obtains the inside view of all LPARs on a pSeries server by default. Note: While performing LPAR discovery, the eG agent will not discover the operating system of the LPARs configured in the Ignore VMs Inside View text box. |
|
Exclude VMs |
Administrators of some virtualized environments may not want to monitor some of their less-critical LPARs both from 'outside' and from 'inside'. The eG agent in this case can be configured to completely exclude such LPARs from its monitoring purview. To achieve this, provide a comma-separated list of LPARs to be excluded from monitoring in the Exclude VMs text box. Instead of LPARs, LPAR name patterns can also be provided here in a comma-separated list. For example, your Exclude VMs pecification can be: *lp,aixlp*,lin*. Here, the * (asterisk) is used to denote leading and trailing spaces (as the case may be). By default, this parameter is set to none indicating that the eG agent obtains the inside and outside views of all AIX LPARs on a virtual host by default. By providing a comma-separated list of LPARs/LPAR name patterns in the Exclude VMs text box, you can make sure the eG agent stops collecting 'inside' and 'outside' view metrics for a configured set of LPARs. |
|
Detailed Diagnosis |
To make diagnosis more efficient and accurate, the eG Enterprise embeds an optional detailed diagnostic capability. With this capability, the eG agents can be configured to run detailed, more elaborate tests as and when specific problems are detected. To enable the detailed diagnosis capability of this test for a particular server, choose the On option. To disable the capability, click on the Off option. The option to selectively enable/disable the detailed diagnosis capability will be available only if the following conditions are fulfilled:
|
| Measurement | Description | Measurement Unit | Interpretation |
|---|---|---|---|
|
Data transferred |
Indicates the amount of data transferred (read or written) in this adapter. |
MB |
The detailed diagnosis of this measure lists the physical disks in the volume group. For each physical disk, the detailed diagnosis page displays the amount of data transferred, read, and written to that physical disk, and the rate of data transfers handled by that physical disk. In the event of a high level of I/O activity on the volume group, you can use this information to identify which physical disk in the volume group is experiencing excessive activity. |
|
Number of data transfers |
Indicates the number of transfers per second issued to this adapter. |
Number/Sec |
|
|
Data reads from adapter |
Indicates the amount of data read from this adapter. |
MB |
|
|
Data writes to adapter |
Indicates the amount of data written to this adapter. |
MB |
|
The detailed diagnosis of the Data transferred measure lists the physical disks in the volume group. For each physical disk, the detailed diagnosis page displays the amount of data transferred, read, and written to that physical disk, and the rate of data transfers handled by that physical disk. In the event of a high level of I/O activity on the volume group, you can use this information to identify which physical disk in the volume group is experiencing excessive activity.
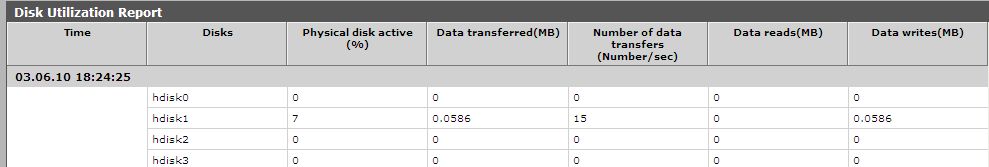
Figure 1 : The detailed diagnosis of the Data transferred measure