Configuring the Database Settings
Figure 1 depicts how the eG database settings can be modified. To access this page, select the Database option from the Settings tile.
The eG database stores:
- The instantaneous measurements reported by the agents,
- Detailed diagnosis measures (if applicable),
- Hourly, daily and monthly trends that summarize the measurements made in the past, and
- Audit logs
- The measure data used for generating reports
- Configuration data and details of configuration changes (if the eG license enables Configuration Management)
To ensure that database size does not grow continuously, the eG manager automatically deletes old entries from the database. The Database Purge Periods section shown in Figure 1 govern when the manager deletes old entries from each of the eG database tables. You can also schedule day-end activities such as trend computation, scheduled mail generation, and cleanup, by specifying the time in the Day-end activities start at this time field.
Note:
- The database purge periods configured for the hourly, daily, and monthly trend data automatically applies to hourly, daily, and monthly capacity computations as well.
- Typically, capacity computations are performed for a test only if the Capacity Planning flag is explicitly enabled for that test using the capacity planning page (refer to Configuring the Capacity Planning System Report Settings ) of the eG admin interface. By default, whenever the eG database cleanup process runs, it checks the status of the Capacity Planning flag of tests and cleans up the old capacity computations of only those tests for which Capacity Planning is enabled at the time of database cleanup. Sometimes, this flag could have been turned on for a few tests for a while, and later turned off. If say, the flag had been turned off before the database cleanup process runs, then the capacity values calculated during this period will remain in the database until the Capacity Planning capability is switched on again for those tests; this is because, cleanup will ignore the old capacity computations for those tests for which the Capacity Planning flag is set to Disabled at the time of cleanup. This stale data therefore may end up occupying critical database space for an infinite period of time! To avoid this, the eG Enterprise system provides you with the option to 'force the cleanup of old capacity data'. By default, this capability is disabled. This is why, by default, the CanForceCapacityCleanup flag in the [misc_args] section of the eg_services.ini file (in the <EG_INSTALL_DIR>\manager\config directory) is set to false. To enable this capability, set this flag to true and save the eg_services.ini file. Once this is done, then, the next time the database cleanup process executes, it will automatically delete the old capacity computations of all tests, regardless of the current status of the Capacity Planning flag - i.e., regardless of whether/not Capacity Planning is Enabled for those tests.
To optimize accesses to the database, the eG manager uses connection pooling. By using a pre-established set of connections and multiplexing requests over these connections, the eG manager ensures that individual connections are not established and closed for each request. The Database Connection Pool Settings section in Figure 1 governs the initial and the maximum number of connections in the connection pool. Consider increasing the number of connections in the connection pool as the number of components monitored or the number of users accessing the system increases. By default, the Maximum connections parameter (see Figure 1) is set to 100.
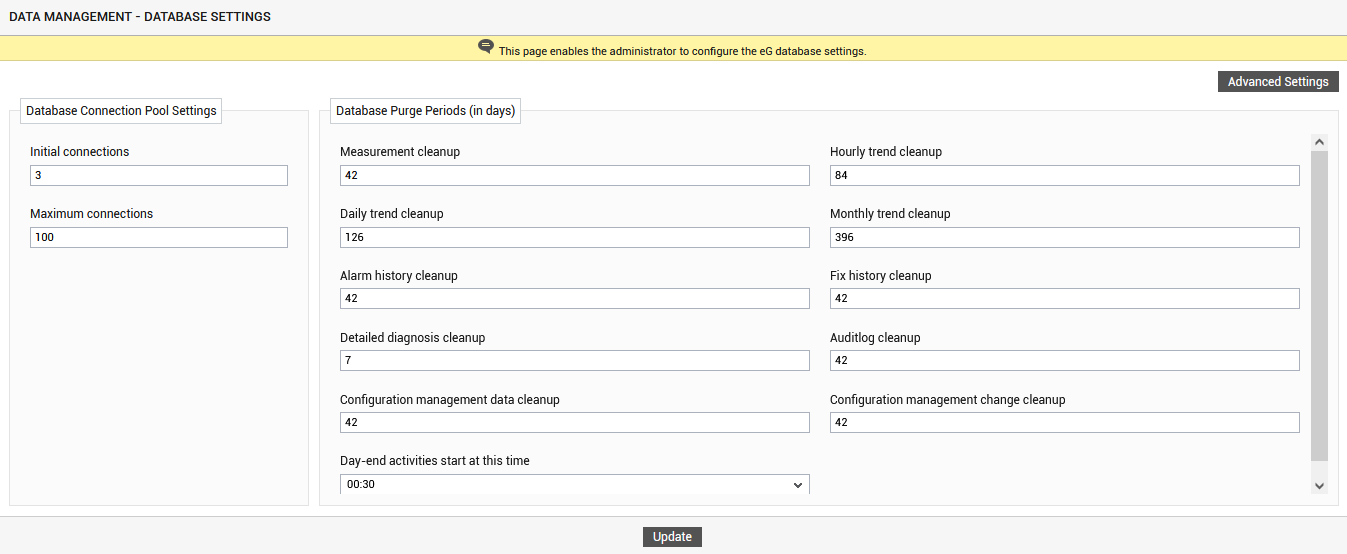
Figure 1 : Configuring the database settings
In some environments, some tests may be configured to run more frequently than others and may therefore store more measure data in the eG database. To conserve database space, administrators are provided with the flexibility to configure a cleanup frequency per test. Likewise, the detailed diagnosis data reported by certain tests may be accumulating too fast when compared to the detailed diagnosis of some other tests. Therefore, it is necessary to configure cleanup frequencies for the detailed diagnosis data too. If you want to configure cleanup frequencies for the detailed diagnosis data reported by specific tests or if you want to configure cleanup frequencies for individual tests that run more frequently than other tests and consumes more database space, click the Advanced Settings button in Figure 1. Figure 2 then appears displaying the default cleanup frequencies for tests executing on All managed component types.
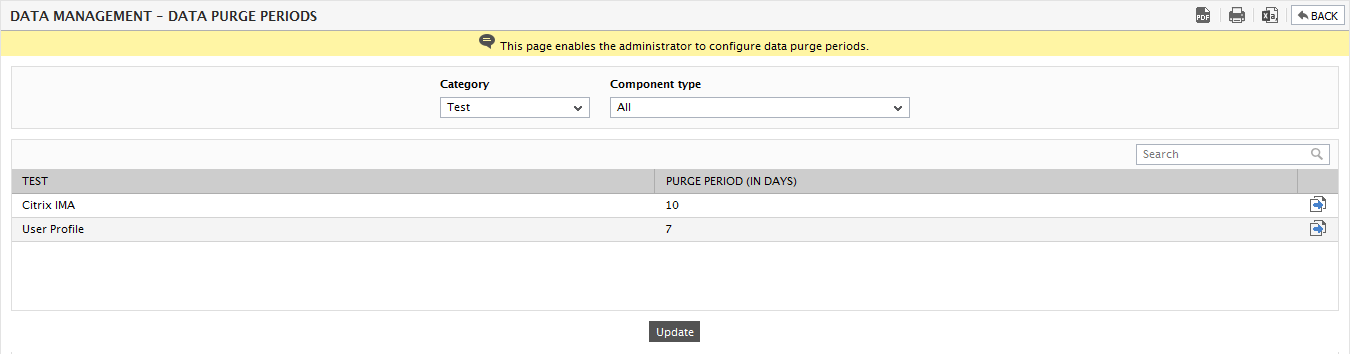
Figure 2 : Configuring the cleanup frequencies for individual tests
If a large number of components have been managed in your environment, then, a long list of tests will appear in Figure 2, making it difficult for you to locate the tests of interest to you. In such situations, you can narrow your search for tests by picking a particular Component type from Figure 2; this way, only those tests that execute on the chosen type and their cleanup frequencies will be listed. You can override the default frequencies by changing them. To save the changes, click the Update button in Figure 2.
Note:
Some tests may be common to more than one component type - for e.g., Network test, operation system-level tests, etc. Such tests will be listed under each of these Component types. However, once the cleanup frequency of such a test is changed for one component type, it will automatically change the cleanup frequency for this test across all other associated component types as well.
Also, if you want the frequency that you have configured for one test to be applied to one/more other tests, regardless of the component-type to which they are mapped, you need not manually change the frequency of each test to this effect. All you need to do instead is follow a simple sequence of mouse clicks to effortlessly update multiple tests across component types with the cleanup frequency of a single test. For this, click on the
 button alongside the source test - i.e., the cleanup frequency of the test that needs to be applied to other tests. This will invoke Figure 3.
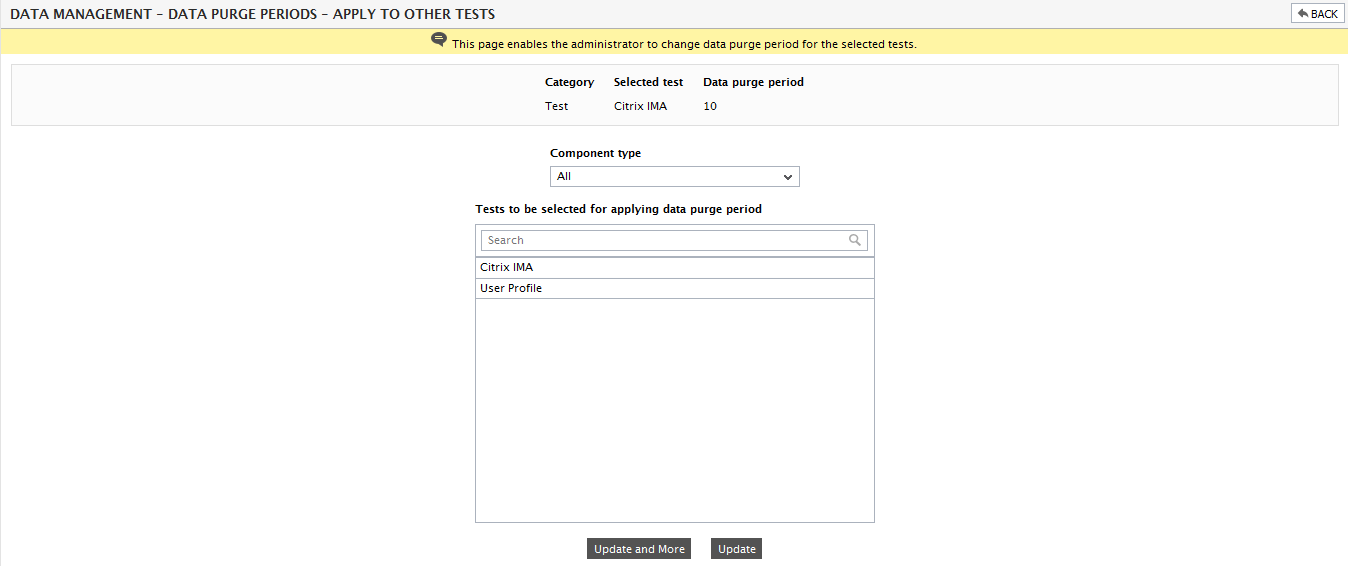
Figure 3 : Applying the cleanup frequency configured for a test to other tests
By default, the All option is chosen from the Component type list in Figure 3. Accordingly, the list of tests displayed pertains to all managed component types, by default. You can filter the Tests list by selecting a particular component type from the Component type list; this ensures that the tests associated with the chosen component type alone are displayed in Figure 3.
From the Tests list in Figure 3, you can pick the tests to which the cleanup frequency of the source test needs to be applied. If you do not want to pick another source test, then simply click the Update button to save the changes and exit the page. If you want to pick a different source test and apply its cleanup frequency to a few other tests, then click the Update and More button.
If you want to view the list of default detailed diagnosis cleanup frequencies for tests executing on All managed component-types, then select the Detailed Diagnosis option from the Category drop down list of Figure 2. Figure 4 then appears.
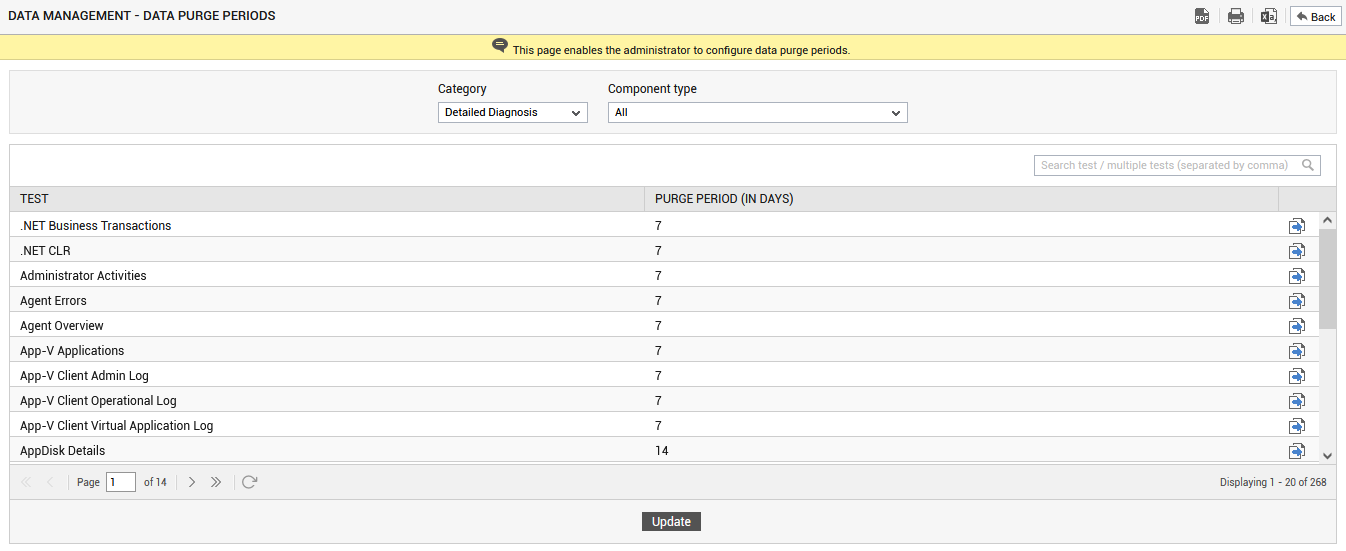
Figure 4 : Configuring the cleanup frequency for detailed diagnosis data pertaining to specific tests
If you want the frequency that you have configured for one test to be applied to one/more other tests, regardless of the component-type to which they are mapped, you need not manually change the frequency of each test to this effect. All you need to do instead is follow a simple sequence of mouse clicks to effortlessly update multiple tests across component types with the diagnosis cleanup frequency of a single test. For this, click on the
button alongside the source test - i.e., the test with a diagnosis frequency that needs to be applied to other tests. This will invoke Figure 3.
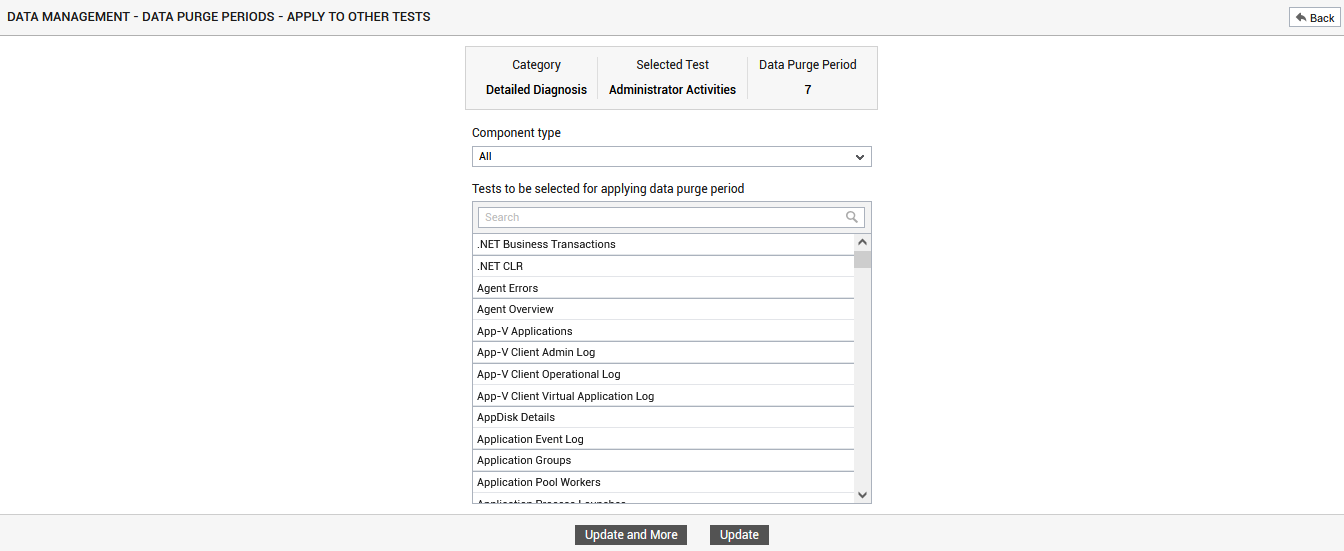
Figure 5 : Applying the diagnosis cleanup frequency configured for a test to other tests
Note:
Some tests may be common to more than one component type - for e.g., Network test, operation system-level tests, etc. Such tests will be listed under each of these Component types. However, once the diagnosis cleanup frequency of such a test is changed for one component type, it will automatically change the diagnosis cleanup frequency for this test across all other associated component types as well.
By default, the All option will be chosen from the Component type list in Figure 3. Accordingly, the list of tests displayed below will pertain to all managed component types, by default. You can filter this tests list by selecting a particular component type from the Component type list; this ensures that the tests associated with the chosen type alone are displayed in Figure 3.
From the tests list in Figure 3, you can pick the tests to which the cleanup frequency of the source test needs to be applied. If you do not want to pick another source test, then simply click the Update button to save the changes and exit the page. If you want to pick a different source test and apply its cleanup frequency to a few other tests, then click the Update and More button.
If you wish to print the purge period of the tests, then, you can do so by clicking the Print icon in Figure 4. Likewise, you can export the purge period of the tests as an Excel file or a PDF file by clicking the appropriate icons provided in Figure 4.
Note:
If a test is picked as a source, then, such a test will not be available for selection in the tests list of Figure 1, regardless of the component-type you choose.
Note:
- The eg_services.ini file in the <EG_INSTALL_DIR>\manager\config directory comprises of an IndexRebuild flag (in its [MISC_ARGS] section). If this flag is set to yes, then the trend manager, upon execution, will automatically initiate an index recreation process. If this process is to be performed manually, then set the IndexRebuild flag to no.
-
A file named eg_indextables.ini also exists in the <EG_INSTALL_DIR>\manager\config directory, which consists of the following entries:
- MaxIndexTime, which indicates the duration (in minutes) for which auto index creation will run. If this parameter is set to 60, it means that the auto index creation will run for 60 minutes, i.e., 1 hour.
- ReBuildFrequency, which governs how frequently the auto index creation process should run. If this parameter is set to 2, it means that the auto index creation process will run every two days.
Note:
- The eG manager keeps track of all the tables that it has created in its database in the eg_db.ini and eg_dbase.ini configuration files. If these files are truncated during the operation of the eG manager (e.g., because the eG manager system ran out of disk space and the configuration files could not be written to disk), the eG manager recreates the measurement tables in the database. The RecreateTables flag in the eg_db.ini configuration file in the <EG_INSTALL_DIR>\manager\config directory controls this operation. If this flag is yes, the database tables are recreated. If this flag is no, the tables are not recreated. The RestartOnCorruption flag controls how the eG manager functions when it detects a table in its database for which entries are missing in the eg_db.ini configuration file. If this flag is set to yes, the eG manager automatically restarts itself when it detects a table in the database but entries for the table are missing in the eg_db.ini file.
- If the eG manager has not run the data purging/cleanup operation for a long time, or if the data retention period has been reduced and a significant amount of data needs to be cleaned up from the eG database, cleaning up a lot of data at one time can impose a lot of stress on the eG database, slowing down user accesses and the performance of the eG manager. Administrators can control the number of days of data that the eG manager can purge during one run of its day-end data purging process. The MaxDaysToCleanOnce setting in the [MANAGER_SETTINGS] section of the eg_db.ini file controls the number of days of measurement data that is purged during one run of the day-end data purging process. A value of 10 indicates that at most 10 days of data is purged during one run. A value of -1 indicates that there is no limit on the amount of data that can be purged during one run.
Note:
- By default, the trend manager uses the connections in the connection pool for execution. To ensure that the trend manager runs on a new connection every time, but not from the connection pool, set the TrendWithDedicatedConnection flag in the [misc_arg] section of the eg_services.ini file (in the <EG_INSTALL_DIR>\manager\config directory to yes. By default, this flag is set to no.
- By default, the database cleanup process is executed as a thread within the eG Tomcat process. Accordingly, the ExecuteCleanupAsProcess flag in the [misc_args] section of the eg_services.ini file is set to no, by default. If you set it to yes, cleanup will run as a separate java process.
- To ensure that the day-end data purging process is throttled according to the availability of connections in the connection pool, a PoolThrottleLimit can be set in the [manager_settings] section of the eg_db.ini file (in the <EG_INSTALL_DIR>\manager\config directory). By default, this is set to 40 (percent). This means that if connection pool usage exceeds 40%, then the cleanup process will be spaced out in such a way, so as to not impact connections to the database. You can however, change this throttle limit based on the normal connection pool usage in your environment.