Applications - AVD Test
This test reports statistics pertaining to the different applications executing on the chosen Session Host / Azure Virtual Desktop and their usage. Resource-intensive / under-performing applications can thus be rapidly captured. Detailed diagnosis points you to the precise users whose experience may probably be impacted by poor application performance.
Target of the test : An Azure Virtual Desktop
Agent deploying the test : An internal agent.
Outputs of the test : One set of results for each application running on the chosen Session Host / Azure Virtual Desktop
| Parameters | Description |
|---|---|
|
Test Period |
How often should the test be executed. |
|
Host |
The host for which the test is to be configured. |
|
Port |
The default port is NULL. |
|
Report By Domain Name |
By default, this flag is set to Yes. This implies that by default, the detailed diagnosis of this test will display the domainname\username of each user who accessed an application on the ACD. This way, administrators will be able to quickly determine which user logged into the AVD from which domain. If you want the detailed diagnosis to display only the user name of these users, set this flag to No. |
|
Show Only Active Apps |
Using this flag, you can indicate whether the test should monitor all applications or applications that are currently active on the AVD. By default, this flag is set to Yes, indicating that only the currently active applications will be monitored by the eG agent. To monitor all applications, you need to set this flag to No. Active applications are those that have at least one instance currently running on the chosen session host. |
|
Show Only Whitelist Apps |
By default, this test monitors all applications that are running on the chosen session host / AVD. If required, you can override this default setting, so the test monitors only specific applications. For this, first set the Show Only Whitelist Apps flag to Yes (default setting is No). Then, do the following:
|
|
Exclude |
By default, this parameter is set to none. This means that the test will monitor all the applications that are running on the AVD, by default. If you want the test to disregard certain applications when monitoring, then provide a comma-separated list of process names that correspond to the applications you want to ignore, in the Exclude text box. For instance, your specification can be: winword.exe,js.exe,taskmgr.exe. Your specification can include wild card patterns as well. For example: *win*,js*,*task |
|
DD Frequency |
Refers to the frequency with which detailed diagnosis measures are to be generated for this test. The default is 1:1. This indicates that, by default, detailed measures will be generated every time this test runs, and also every time the test detects a problem. You can modify this frequency, if you so desire. Also, if you intend to disable the detailed diagnosis capability for this test, you can do so by specifying none against DD Frequency. |
|
Detailed Diagnosis |
To make diagnosis more efficient and accurate, the eG Enterprise embeds an optional detailed diagnostic capability. With this capability, the eG agents can be configured to run detailed, more elaborate tests as and when specific problems are detected. To enable the detailed diagnosis capability of this test for a particular server, choose the On option. To disable the capability, click on the Off option. The option to selectively enable/disable the detailed diagnosis capability will be available only if the following conditions are fulfilled:
|
| Measurement | Description | Measurement Unit | Interpretation |
|---|---|---|---|
|
Processes running |
Number of instances of this application currently executing on the chosen Session Host / AVD. |
Number |
This value indicates if too many or too few instances corresponding to an application are executing on the host. Use the detailed diagnosis of this measure to identify all the users executing this application and comparing the users will help you to identify which user is utilizing the maximum memory, CPU etc |
|
CPU usage |
Indicates the percentage of CPU used by this application. |
Percent |
A very high value could indicate that the specified application is consuming excessive CPU resources. |
|
Memory usage |
This value represents the ratio of the resident set size of the memory utilized by the application to the physical memory of the host system, expressed as a percentage. |
Percent |
A sudden increase in memory utilization for an application may be indicative of memory leaks in the application. |
|
Handle count |
Indicates the number of handles opened by this application. |
Number |
An increasing trend in this measure is indicative of a memory leak in the application. |
|
Number of threads |
Indicates the number of threads that are used by this application. |
Number |
|
|
I/O data rate: |
Indicates the rate at which this application is reading and writing bytes in I/O operations. |
KBytes/Sec |
This value counts all I/O activity generated by each instance of the application and includes file, network and device I/Os. |
|
I/O data operations |
Indicates the rate at which this application is issuing read and write data to file, network and device I/O operations. |
Operations/Sec |
|
|
I/O read data rate |
Indicates the rate at which this application is reading data from file, network and device I/O operations. |
KBytes/Sec |
|
|
I/O write data rate |
Indicates the rate at which this application is writing data to file, network and device I/O operations. |
KBytes/Sec |
|
|
Page fault rate |
Indicates the total rate at which page faults are occurring for the |
Faults/Sec |
This measure is a good indicator of the load on the application. A page fault occurs when a thread refers to a virtual memory page that is not in its working set in main memory. This may not cause the page to be fetched from disk if it is on the standby list and hence already in main memory, or if it is in use by another application with whom the page is shared. |
|
Working set memory |
Indicates the current size of the working set of this application. |
MB |
The Working Set is the set of memory pages touched recently by the threads in a process/application. If free memory in the server is above a threshold, pages are left in the Working Set of an application even if they are not in use. When free memory falls below a threshold, pages are trimmed from Working Sets. If they are needed they will then be soft-faulted back into the Working Set before leaving main memory. Comparing the working set across applications indicates which application is taking up excessive memory. |
|
Private working set memory |
Indicates the amount of memory that this application is using, which it cannot share with other applications. |
MB |
A high value for this measure is indicative of a memory-hungry application. |
|
Input delay for processes - max |
Indicates the maximum amount of time lag detected between the user's input through any input device (e.g., mouse, keyboard) and the time at which this application detected the input. |
Seconds |
Poor application performance is one of the most difficult problems to diagnose by the administrators. Traditionally, diagnosis was done by collecting CPU, memory, disk I/O and a few other metrics. The data collected from traditional metrics were not sufficient to figure out the root cause of poor performance of the applications since the variations measured by the metrics were large. In virtual environments where multiple users accessed an application from remote at the same time, users faced difficulties in accessing the application whenever there was an increase in the count of users. The more the users are accessing the application, the higher was the CPU usage of the systems in the environment and the higher was the user input delays i.e., the users were forced to wait for a longer duration to interact with the application. The user input delay is measured by how long any user input (such as mouse or keyboard usage) stays in the queue before it is picked up by a process. These two measures capture such user input delays at the application/process level. These insights enable administrators to accurately identify which application/process is responding slowly to user requests. Ideally, the values of these measures should be 0 or very low. |
|
Input delay for processes - avg |
Indicates the average amount of time lag detected between the user's input through any input device (e.g., mouse, keyboard) and the time at which this application detected the input. |
Seconds |
The detailed diagnosis of the Processes running measure, if enabled, lists the user sessions that are currently open, the process ids of the processes being executed by each of the users, and the CPU and memory utilization (in %) of each of these processes. Additionally, this detailed diagnosis helps you in identifying the handles that are opened, the thread count, the read/write operations as well as the I/O operations for each application. This information enables the administrator to identify the processes with a high CPU/memory utilization. In the event of an overload, the administrator might decide to terminate these processes (see Figure 1).
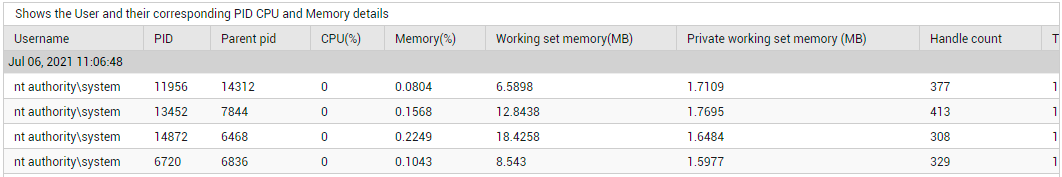
Figure 1 : The detailed diagnosis for the Processes running measure