Processes - AVD Test
Application processes can be identified based on specific regular expression patterns. For example, web server processes can be identified by the pattern *httpd*, while DNS server processes can be specified by the pattern *named* where * denotes zero or more characters. For each such pattern running on a chosen Session Host / Azure Virtual Desktopp, the process test reports a variety of CPU and memory statistics.
Target of the test : An Azure Virtual Desktop
Agent deploying the test : An internal agent
Outputs of the test : One set of results per process pattern specified
| Parameters | Description |
|---|---|
|
Test Period |
How often should the test be executed. |
|
Host |
The host for which the test is to be configured. |
|
Port |
The default port is NULL. |
|
Process |
In the Process text box, enter a comma separated list of names:pattern pairs which identify the process(es) associated with the AVD being considered. processName is a string that will be used for display purposes only. processPattern is an expression of the form - *expr* or expr or *expr or expr* or *expr1*expr2*... or expr1*expr2, etc. A leading '*' signifies any number of leading characters, while a trailing '*' signifies any number of trailing characters. For example, say that the session host / AVD in question has three processes running, namely kcs, kjs, and kxs. In this case, in the Process text box, enter "kcsProcess:*kcs*, kjsProcess:*kjs*, kxsProcess:*kxs*, where * denotes zero or more characters. Other special characters such as slashes (\) can also be used while defining the process pattern. Note: The Process parameter supports process patterns containing the ~ character. To determine the process pattern to use for your application, on Windows environments, look for the process name(s) in the Task Manager -> Processes selection. Also, while monitoring processes on the session host / AVD, if the Wide parameter of this test is set to Yes, then your process patterns can include the full path to the process and/or the arguments supported by the process. For instance, your processpattern specification can be as follows: Terminal:C:\WINDOWS\System32\svchost -k DcomLaunch,Remote:C:\WINDOWS\system32\svchost.exe -k netsvcs To save the time and effort involved in such manual process specification, eG Enterprise offers an easy-to-use auto-configure option in the form of a View/Configure processes button that is available next to the Process text box. Refer to Auto-configuring the Process Patterns to be Monitored to know how to use the auto-configure option. |
|
User |
By default, this parameter has a value "none"; this means that the test monitors all processes that match the configured patterns, regardless of the user executing them. If you want the test to monitor the processes for specific users alone, then, specify a comma-separated list of "domain name-user name" pairs, where every pair is expressed in the following format: Domainname\Username. For example, to monitor the processes of user john and elviswho belong to domain mas, your user specification should be: mas\john,mas\elvis. Also, you will find system processes running on the following user accounts: SYSTEM, LOCAL SERVICE, and NETWORK SERVICE. While configuring these user accounts, make sure the Domainame is always NT AUTHORITY. In this case therefore, your user specification will be: NT AUTHORITY\SYSTEM,NT AUTHORITY\LOCAL SERVICE,NT AUTHORITY\NETWORK SERVICE. If multiple processes are configured for monitoring and multiple users are also configured, then the test will check whether the first process is run by the first user, the second process by the second user, and so on. For instance, if the processes configured are java:java.exe,apache:*httpd* and the users configured are john,elvis, then the test will check whether user john is running the process java, and user elvis is running the process apache. Similarly, if multiple processes are configured, but a single user alone is configured, then the test will check whether the specified user runs each of the configured processes. However, if you want to check whether a single process, say java.exe, is run by multiple users - say, james and jane - then, you have to do the following:
|
|
Wide |
By default, the eG agent uses perfmon to search for the processes that match the configured patterns. Accordingly, the Wide parameter is set to Noby default. Typically, a process definition in Windows includes the full path to the process, the process name, and process arguments (if any). Perfmon however scans the system only for process names that match the configured patterns – in other words, the process path and arguments are ignored by perfmon. This implies that if multiple processes on a Windows host have the same name as specified against processpattern, then perfmon will only be able to report the overall resource usage across all these processes; it will not provide any pointers to the exact process that is eroding the host’s resources. To understand this better, consider the following example. Typically, Windows represents any Java application executing on it as java.exe. Say, two Java applications are executing on a Windows host, but from different locations. If java.exe has been configured for monitoring, then by default, perfmon will report the availability and average resource usage of both the Java applications executing on the host. If say, one Java application goes down, then perfmon will not be able to indicate accurately which of the two Java applications is currently inaccessible. Therefore, to enable administrators to easily differentiate between processes with the same name, and to accurately determine which process is unavailable or resource-hungry, the eG agent should be configured to perform its process searches based on the process path and/or process arguments, and not just on the process name – in other words, the eG agent should be configured not to use perfmon. To achieve this, first, set the Wide parameter to Yes. This will instruct the eG agent to not use perfmon to search for the configured process patterns. Once this is done, then, you can proceed to configure a processpattern that includes the process arguments and/or the process path, in addition to the process name. For instance, if both the Remote Access Connection Manager service and the Terminal Services service on a Windows host, which share the same name – svchost - are to be monitored as two different processes, then your processpattern specification should be as follows: Terminal:C:\WINDOWS\System32\svchost -k DcomLaunch,Remote:C:\WINDOWS\system32\svchost.exe -k netsvcs You can also use wildcard characters, wherever required. For instance, in the above case, your processpattern can also be: Terminal:*svchost -k DcomLaunch,Remote:*svchost.exe -k netsvcs Similarly, to distinctly monitor two processes having the same name, but operating from different locations, your specification can be: JavaC:c:\javaapp\java.exe,JavaD:d:\app\java.exe Note:
|
|
Correct |
Increased uptime and lower mean time to repair are critical to ensuring that IT infrastructures deliver a high quality of service to users. Towards this end, the eG Enterprise embeds an optional auto-correction capability that enables eG agents to automatically correct problems in the environment, as soon as they occur. With this capability, as and when an abnormal situation is detected, an eG agent can initiate corrective actions automatically to resolve the problem. Automatic correction without the need for manual intervention by IT operations staff reduces service downtime and improves operational efficiency. By default, the auto-correction capability is available in the eG Enterprise for the Processes running measure of Processes - AVD test, and the Service availability measure of Windows Services - AVDtest. The eG Enterprise includes a default auto-correction script for Processes - AVD test. When a process that has been configured for monitoring stops, this script automatically executes and starts the process. To enable the auto-correction capability for the Processes - AVD test, first, select the Yes option against the Correct parameter in this page (by default, No will be selected here). |
|
Alarm Type |
Upon selecting the Yes option against Correct, three new parameters, namely, Alarm Type, User Params, and Corrective Script will appear. You can set the corrective script to execute when a specific type of alarm is generated, by selecting an option from the Alarm Type list box. For example, if the Critical option is chosen from the Alarm Type list box, then the corrective script will run only when a critical alarm for the Processes - AVD test is generated. Similarly, if the Critical/Major option is chosen, then the corrective script will execute only when the eG Enterprise system generates critical or major alarms for the Processes - AVD test. In order to ensure that the corrective script executes regardless of the alarm type, select the Critical/Major/Minor option. |
|
User Params |
The user-defined parameters that are to be passed to the corrective script are specified in the User Params text box. One of the following formats can be applied to the User Params specification: exec@processName:command: In this specification, processName is the display name of the process pattern specified against the Process parameter, and command is the command to be executed by the default script when the process(es) represented by the processName stops. For example, assume that the :Process parameter of Processes - AVD test has been configured in the following manner: Apache:*\eGurkha\manager\apache\bin\httpd*,Tomcat:*java*tomcat*, where Apache and Tomcat are the processNames or display names of the configured patterns. If auto-correction is enabled for these processes, then the User Params specification can be as follows: exec@Apache:C:\eGurkha\manager\apache\bin\apachectl start,Tomcat:C:\tomcat\bin\catalina.bat start This indicates that if the processes configured under the processName "Apache" stop (i.e. *\eGurkha\manager\apache\bin\httpd*), then the script will automatically execute the command "C:\eGurkha\manager\apache\bin\apachectl start" to start the processes. Similarly, if the "Tomcat" processes (i.e. *java*tomcat*) stop, the script will execute the command "C:\tomcat\bin\catalina.bat start" to start the processes. command: In this specification, command signifies the command to be executed when any of the processes configured for monitoring, stop. Such a format best suits situations where only a single process has been configured for monitoring, or, a single command is capable of starting all the configured processes. For example, assume that the Process parameter has been configured to monitor IISWebSrv:*inetinfo*. Since only one process requires monitoring, the first format need not be used for configuring the User Params. Therefore, simplify specify the command, "net start World Wide Web Publishing Service". Note:
|
|
Corrective Script |
Specify none in the Corrective Script text box to use the default auto-correction script. Administrators can build new auto-correction capabilities to address probable issues with other tests, by writing their own corrective scripts. To know how to create custom auto-correction scripts, refer to the eG User Manual. |
| Measurement | Description | Measurement Unit | Interpretation |
|---|---|---|---|
|
Processes running |
Number of instances of a process(es) currently executing on a host. |
Number |
This value indicates if too many or too few processes corresponding to an application are executing on the host. |
|
CPU utilization |
Percentage of CPU used by executing process(es) corresponding to the pattern specified. |
Percent |
A very high value could indicate that processes corresponding to the specified pattern are consuming excessive CPU resources. |
|
Memory utilization |
For one or more processes corresponding to a specified set of patterns, this value represents the ratio of the resident set size of the processes to the physical memory of the host system, expressed as a percentage. |
Percent |
A sudden increase in memory utilization for a process(es) may be indicative of memory leaks in the application. |
Note:
Special characters that are not allowed as part of your manual pattern specifications are as follows:
-
` (Grave Accent)
-
| (Vertical bar)
-
< (less than)
-
> (greater than)
-
~ (tilda)
-
@ (at)
-
# (hash)
-
% (Percent)
Note:
-
Administrators can extend the built-in auto-correction capabilities to address probable issues with the other measures of the Processes - AVD test, by writing their own corrective scripts for the same. The custom-defined script can be associated with the Processes - AVD test in the same manner discussed above.
-
The name of the custom-defined script should be of the following format: InternalTestName_InternalMeasureName. For example, a script that is written to correct problems with the CPU utilization measure (of the Processes - AVD test) should be named as "WVDProcessTest_Cpu_util”, where WVDProcessTest is the internal name of the Processes - AVD test, and Cpu_util is the internal name for the CPU utilization measure. To know the internal names of tests and measures, use any of the eg_lang*.ini file in the <EG_INSTALL_DIR>\manager\config directory. The script extensions will differ according to the operating system on which it will execute. The extensions supported by Windows environments are: .bat, .exe, .com, and .cmd. Scripts to be executed on Unix environments do not require any extension. The most commonly used extension is .sh.
-
At any given point of time, only one script can be specified in the Corrective Script text box.
-
As already stated, the sample script for Processes - AVD test will be available for every operating system. If the script is uploaded to the eG manager once for an operating system, it will automatically apply to all the agents executing on the same operating system. For example, say that an environment comprises of 3 agents, each executing on a different AVD. While configuring the Processes - AVD test for one of the AVDs, if the administrator uploads the sample script, then he/she will not have to repeat the process for the other 2 AVDs.
-
Once the eG agent downloads a corrective script from the eG manager, any changes made to the script in the manager side will not be reflected in the agent side, immediately. This is because, the eG agent checks the manager for the existence of an updated version of the corrective script, only once a day. If an update is available, the agent downloads the same and overwrites the script that pre-exists.
Auto-configuring the Process Patterns to be Monitored
To save the time and effort involved in manual process specification, eG Enterprise offers an easy-to-use auto-configure option in the form of a  button that is available next to the PROCESS text box.
To auto-configure the processes to be monitored, do the following:
-
Click on the
icon next to the Process text box in the Processes - AVDtest configuration page (see Figure 1).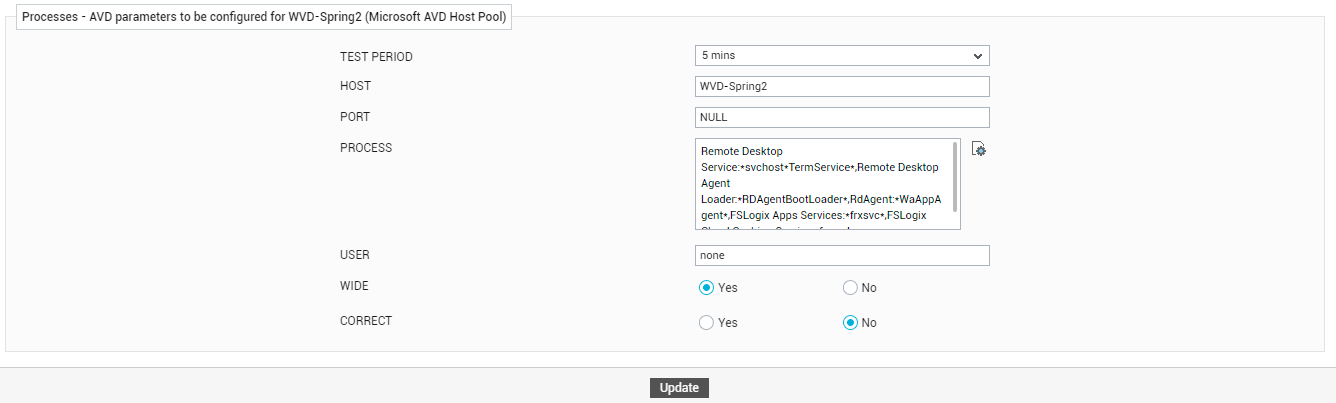
Figure 1 : Configuring the Processes - AVD test
Note:
The
icon will appear only if the following conditions are fulfilled:-
The Processes - AVD test must be executed in an agent-based manner.
-
The eG agent executing the test should be of version 5.2 or above.
-
In case the eG manager in question is part of a redundant manager setup, then the agent executing the test must be reporting metrics to the primary manager only.
-
-
When the
icon is clicked, a process configuration page will appear (see Figure 2). 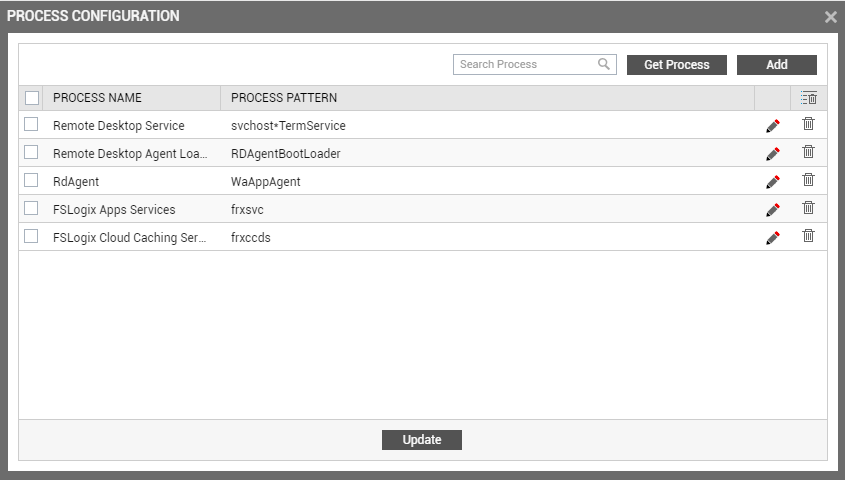
-
Upon clicking the Get Processes button in the process configuration page (see Figure 2), a pop up window with a list of processes that are running on the host will be displayed (see Figure 3).
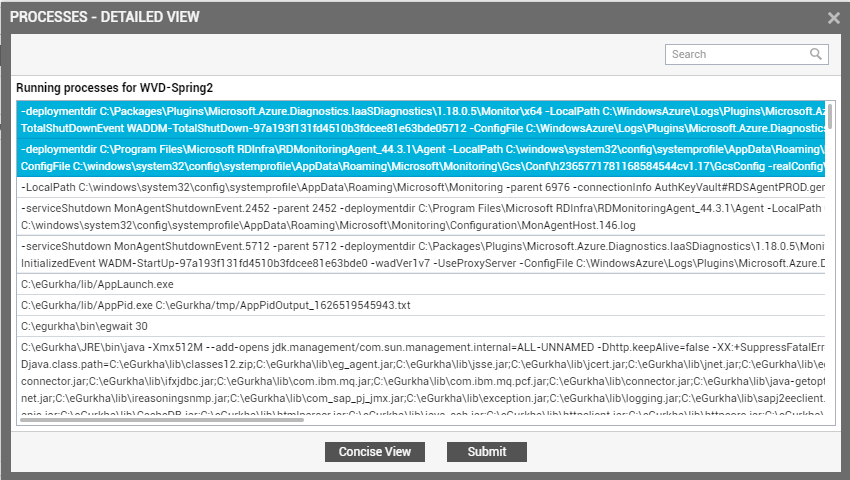
Figure 3 : List of auto-discovered processes
Note:
The processes that are already configured for monitoring will not be listed in Figure 3.
-
By default, Figure 3 provides a 'detailed' view of the process list - i.e., complete process path and process arguments accompany each auto-discovered process. To view only the process names, sans the path / arguments, you need to switch the concise view. For that, click on the Concise View button in Figure 3. Figure 4 will then appear.
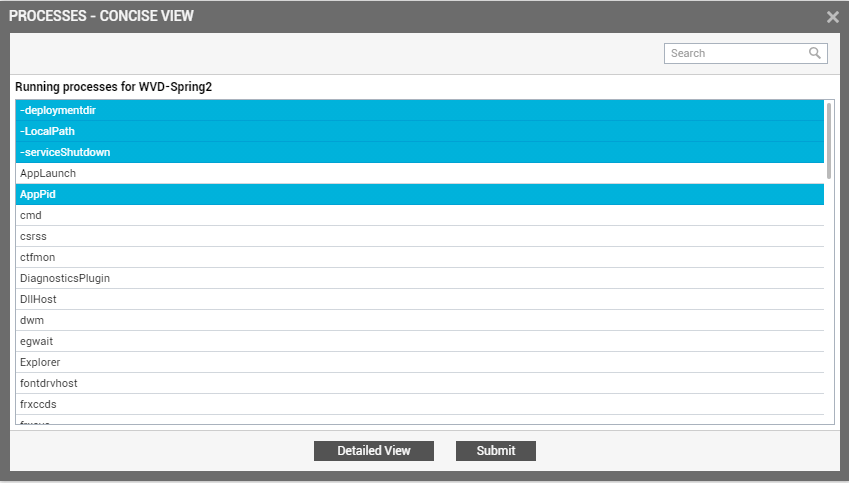
- As you can see, the concise view lists only the process names.
Regardless of the view you are in, select the process or list of processes that require monitoring and click the Submit button in the pop-up window. Note that you can select processes from both the views. If there are too many processes running in the host to choose from, you can narrow your search further by using the Search text box. Specify the whole/part of the process name to search for in this text box, and click the icon next to it.
Note:
The Processes - AVD test includes a Wide flag that is set to Yes by default. In this case, your process specification can include the process path and arguments (if any). Therefore, if the Wideflag is set to Yes, then, the eG agent will report metrics for the process(es) that are selected in both the concise manner and detailed manner. If the Wide flag is set to No, the eG agent will collect metrics only for the process(es) that are selected in a concise manner.
-
Instead of auto-discovering the process names, you can choose to manually specify the names of processes you want monitored. For that, click the Add button in Figure 2. Figure 5 will then appear. Against Process name here, specify a display name for the process; this will appear as a descriptor of the test. In the Process pattern text box, specify the pattern of processes you want monitored - eg., where you provide a display name for the process to be monitored. A Process pattern is an expression of the form - *expr* or expr or *expr or expr* or *expr1*expr2*... or expr1*expr2, etc. A leading '*' signifies any number of leading characters, while a trailing '*' signifies any number of trailing characters. After specifying the name and pattern, click the Update button to save the changes.
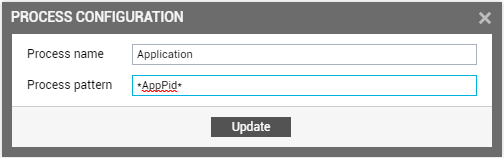
Figure 5 : Manually specifying the process pattern to be monitored
-
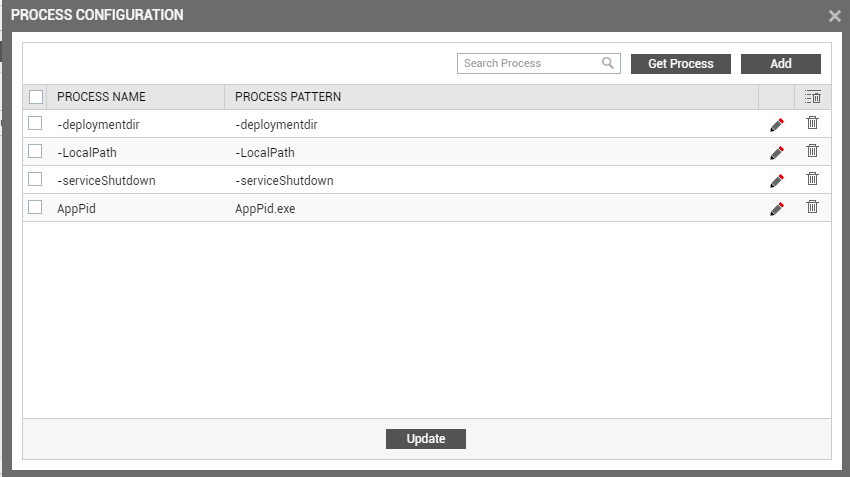
Clicking on the Submit button in Figure 4 or the Update button in Figure 5 will invoke Figure 6, where the chosen auto-discovered processes / manually configured processes will appear.
-
To remove a process specification from Figure 6, just click on the
 icon that corresponds to it. You can also modify contents a process specification, click on the
  icon that corresponds to it.
 Note:
Duplicate processes will appear in the list of processes pop-up, provided the process description is different - for instance, if a 'cmd.exe' process and a 'cmd.bat' process execute on the same host, then both processes will be listed as 'cmd' in the 'concise' view of the process list. If such duplicate processes are chosen for monitoring, then, each process will appear as a separate Process Name and Process Pattern pair in the process configuration page. To proceed, the user must enter a different name for each process using the
icon, so that every distinct pattern can be identified in a unique manner. -
If you want to clear all the processes that you have added for monitoring, select all the processes by simply clicking the check button provided in the header row and click on the
 icon at the right-corner of the table. This action will remove all the processes in single click. If you want to remove some of the processes, then select only those processes by checking the check buttons that correspond to them and click on the icon. This will remove the chosen processes alone.
 -
To proceed to monitor all the processes listed in , click the Update button therein.