Adding a Perfmon-based Test
A test of the Perfmon type can be executed only on Windows environments. Various applications and services on Windows environments expose critical performance statistics via perfmon counters. To allow an administrator to monitor any perfmon counter without having to write elaborate programs, the Integration Console includes a Perfmon test type.
This section facilitates the easy understanding and effective implementation of the Perfmon test type, by taking the help of an illustrated example.
In this example, a ProcessorTest_ex of type Perfmon will be created and its measures will be configured.
As before, begin adding a new test by selecting the Test option from the Integration Console tile. In the integration console - test page that appears next, click the Add New Test button. The new test details page (see Figure 2.54) appears, wherein the following details need to be provided for our example:
-
Test name : ProcessorTest_ex
Note:
While adding a new test using the Integration Console, ensure that the Test name always ends with _ex. If not, an error message (see Figure 3) will appear upon clicking the add button in Figure 1.
- Duplicate : Since the new test is not a duplicate of any existing test, set the Duplicate flag to No.
-
Execution : Internal, as an internal agent will be executing the ProcessorTest_ex
Note:
Using the Integration Console plugin, you can add an internal or an external test, but you cannot add tests that need to be run by a remote agent – i.e., tests that need to be executed in an agentless manner.
- Port based : As the ProcessorTest_ex is to be run at the system level, select No against Port Based to enable it to be associated with any of the server types.
- Test type : Perfmon
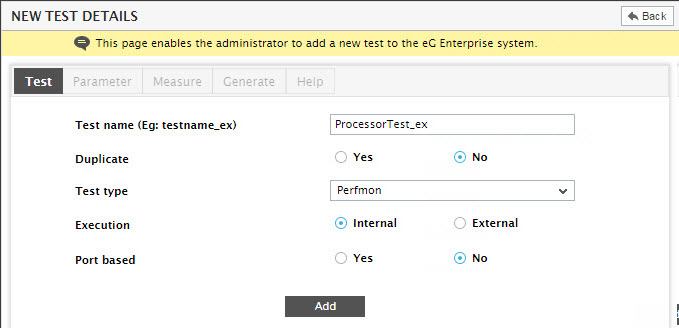
Figure 1 : Adding a new test of type Perfmon
Then, click the Add button to add the new test to the eG Enterprise system. The Parameter tab page then opens (see Figure 2). Since the ProcessorTest_ex in our example does not take any additional parameters, click the Measure tab in Figure 2 to configure measures for the test.
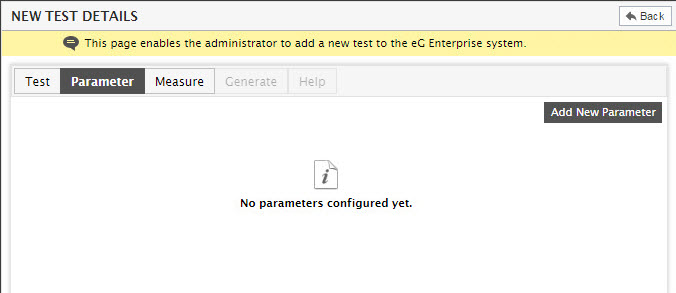
Figure 2 : The Parameter tab page that appears when configuring a test of type Perfmon
Figure 3 will then appear. Click the Add New Measure button in Figure 3 to add a new measure for the test.
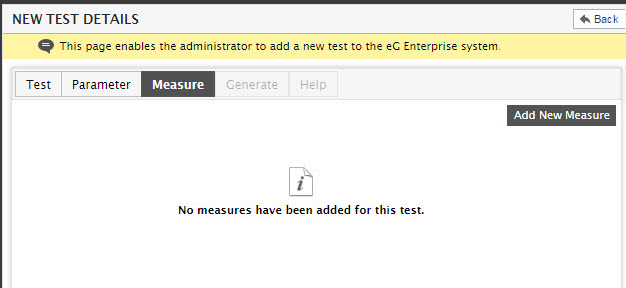
Figure 3 : The Measure tab page indicating that no measures have been configured yet for the Perfmon Test
Figure 4 shows how a measurement of the Perfmon test type is specified. Here, specify Privileged_Time as the Measure name. Then, mention the Database column size, the Unit, the Conversion Factor, and the Process method in the same manner as discussed in the previous section. Here again, leave the Alarm display string blank.
Note:
- To know more about the Process method, refer to Adding a Script/Batch File-based Test.
- To know more about the Conversion factor, refer to Adding a Custom Performance Test .
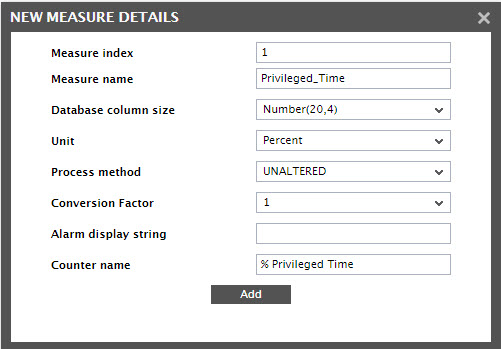
Figure 4 : Specification of the first output (Privileged_Time) of the ProcessorTest_ex of type Perfmon
In addition to the above, a Counter name text box exists (see Figure 4). Against this text box, enter the name of the perfmon counter associated with the specified measure. The name of the perfmon counter should be the same as that which appears in the Add Counters dialog box of the Performance console in a Microsoft Windows server (see Figure 5).
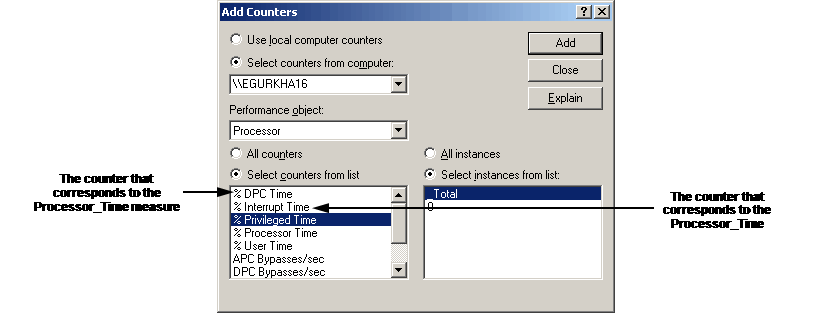
Figure 5 : The Add Counters dialog box
After specifying all the required details, click on the Add button in Figure 4 to add the first measure of the eG Enterprise system. You will then be prompted to indicate whether you want to add more measures for the test. To add another measure, click the Yes button at the prompt. The new measure details window will pop up once again (see Figure 6). Provide the details of the Processor_Time measure in Figure 6.
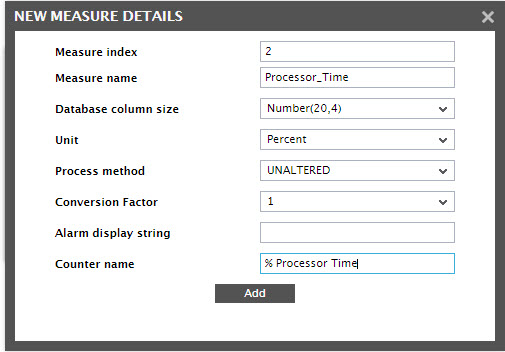
Figure 6 : Specifying the object and instance names associated with the measures
Once the second measure is added, you will once again be prompted to indicate whether/not you want to add more measures for the test. This time, click No at the prompt. This will automatically lead you to the Generate tab page (see Figure 7).
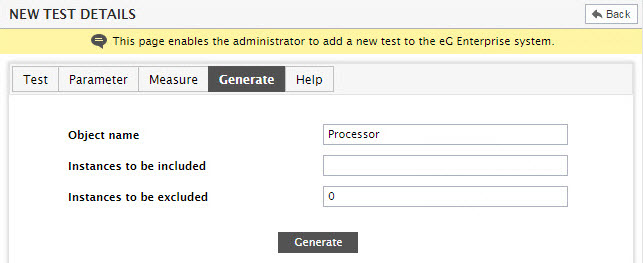
Figure 7 : Configuring the implementation of the Perfmon test
As shown in Figure 7, proceed to specify the following details:
- Object name – Enter the name of the performance object with which the specified measures are associated. This information can be obtained from the Add Counters dialog box of the Performance console in a Microsoft Windows server (see Figure 8).
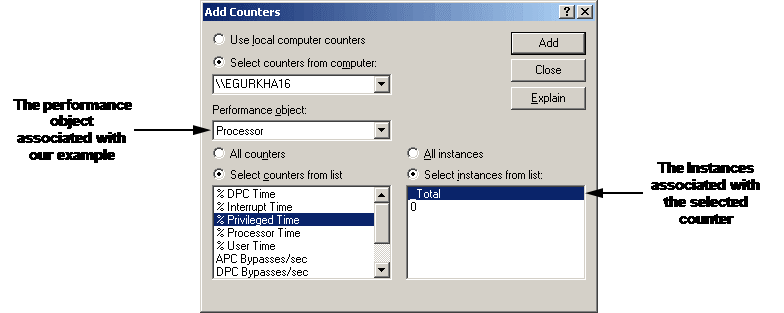
Figure 8 : The performance object associated with our example
- Instances to be included – Mention the specific instances of the measure that need to be monitored. Separate the multiple instances by commas (,). The list of instances associated with a counter can be obtained from the Add Counters dialog box of the Performance console in a Microsoft Windows server (see Figure 8).
- Instances to be excluded – If the Instances to be included are large in number, specify the Instances to be excluded instead. eG Enterprise can thus be instructed to consider all instances except the ones specified against this field, during monitoring. The list of instances associated with a counter can be obtained from the Add Counters dialog box of the Performance console in a Microsoft Windows server. In our example, “0” has been specified against the Instances to be excluded text box (see Figure 8). From Figure 8, we can infer that _Total and 0 are the two instances associated with the % Privileged Time counter of the Processor performance object. The same instances are also available for the % Processor Time counter. Our example however, requires the measures pertaining to instance _Total only. Therefore, in order to exclude the instance “0”, the same has been specified in the Instances to be excluded text box.
Note:
The Object names and names of Instances should be exactly the same as that which appear in the Add Counters dialog box of the Windows Perfmon console. Even the case and spaces should match. Otherwise, measures will not be reported.
For more details on performance objects and instances, refer to the Microsoft Windows documentation.
Finally, click the Generate button to integrate the test’s implementation into the eG Enterprise system.
When a test’s measurements are successfully configured, the eG Enterprise system prompts the user to specify the default threshold settings for each of the measurements made by the newly added test (see Figure 9).
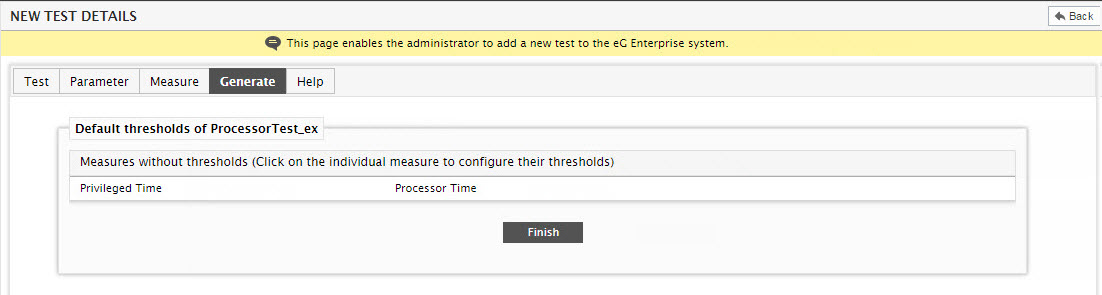
Figure 9 : Specifying the threshold values for the measures of the ProcessorTest_ex