Adding a Custom Performance Test
To illustrate the procedure for adding and configuring a Custom performance test, this section will be considering two examples. The test that will be added in the first example is the MsFileTest. This test should report statistics pertaining to the number of files locked on a server, and the unique count of users with open files on that server. In the first example, this test will not be configured with the detailed diagnosis capability. In the second example, the locked file count measure of the MsFileTest will be configured to report detailed diagnostics revealing the details of the files that are locked.
Adding a Custom Performance Test Without Detailed Diagnosis
The first step towards building the MsFileTest in our example is to access the integration console – test page. For this, first login to the eG admin interface as a user with Admin rights, invoke the Admin tile menu, and pick the Test option from the Integration Console tile (see Figure 1).
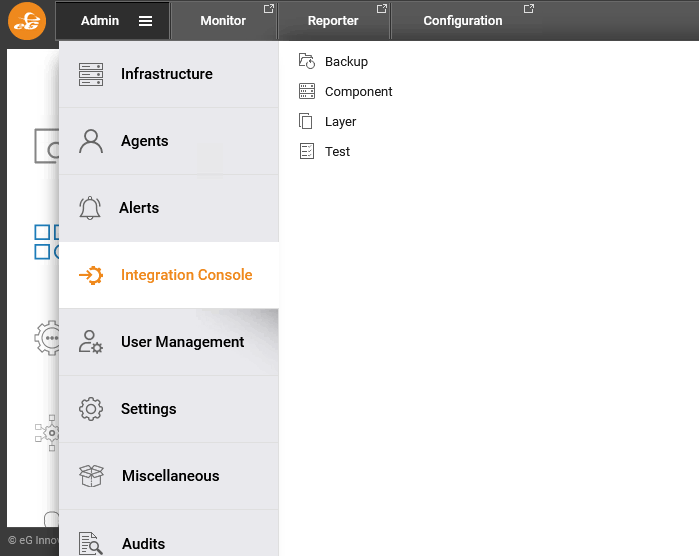
Figure 1 : Selecting the Test option from the Integration Console tile
To add a new test, click on the Test option in Figure 1. A set of user-defined tests that have been previously added to eG Enterprise (if any) will be displayed (see Figure 2). Click the Add New Test button in Figure 2 to add a new test to eG Enterprise.
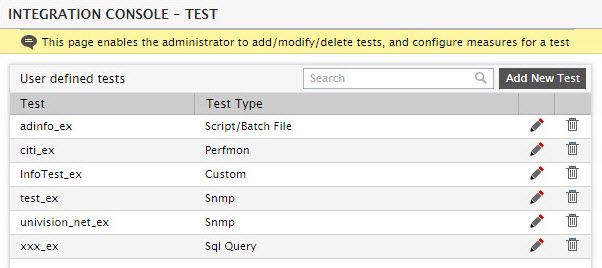
Figure 2 : List of user-defined tests that pre-exist
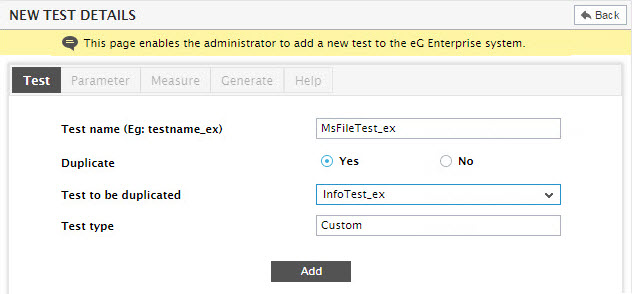
Figure 4 shows the inputs that have to be specified to add a new test. First, specify the Test name as shown in Figure 4.
Note:
While adding a new test using the Integration Console, ensure that the Test name always ends with _ex. If not, an error message (see Figure 3) will appear upon clicking the add button in Figure 2.
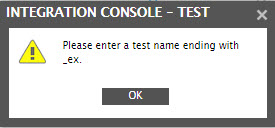
Figure 3 : A message box stating that the test name should end with “_ex”
Click the OK button in the message box to close it, and proceed to provide the Test name in the prescribed format.
Once the test name is specified, you will have to indicate whether/not the test being added is a duplicate of an existing test. eG Enterprise allows users to duplicate an existing IC-based test, so that the complete configuration of the existing test (i.e., the test type, the test parameters, its measures, and all other test specifications except the test name) is automatically copied to the new test. This duplication is particularly useful when you want to create two/more tests with the same/similar functionality, and assign them to different layers or components.
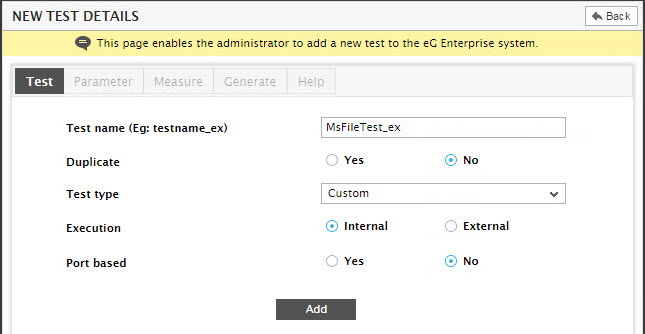
Figure 4 : Specifying the inputs corresponding to a new Custom test
If the test being added is a duplicate of an existing test, then set the Duplicate flag in Figure 4 to Yes. From the Test to be duplicated list that then appears (see Figure 5), pick the existing test that is to be duplicated. Upon selection of the test, the Test type of the chosen test will automatically apply to the new test. Now, click the Add button to add the new test.
On the other hand, if you set the Duplicate flag to No, then you would have to explicitly provide the new test’s details. The MsFileTest_ex in our example is not a duplicate of any other test. Therefore, set the Duplicate flag to No and proceed to specify the mode of Execution of the test (see Figure 4). The Execution field governs whether the test is to be executed by an internal agent or by an external agent. As a rule of thumb, if the test relies on application counters, log files, etc., it must be executed by an internal agent. On the other hand, if the test uses the Simple Network Management Protocol (SNMP), HTTP, or emulates user requests it can be executed by an external agent.
Note:
Using the Integration Console plugin, you can add an internal or an external test, but you cannot add tests that need to be run by a remote agent – i.e., tests that need to be executed in an agentless manner.
When adding a test, you also have to specify whether the test is Port based or not. In other words, you have to indicate whether the test corresponds to a server that is listening on a specific TCP/UDP port or not.
Apart from the above, the Test type has to be selected. For the purpose of our example, select Custom as the Test type. Then, click the Add button to add the new test to the eG Enterprise system.
When the test is successfully added, control will automatically switch to the Parameter tab page of the new test details page (as shown by Figure 6). Parameters refer to the arguments that a test needs to be configured with in order to run and collect performance statistics from a target.
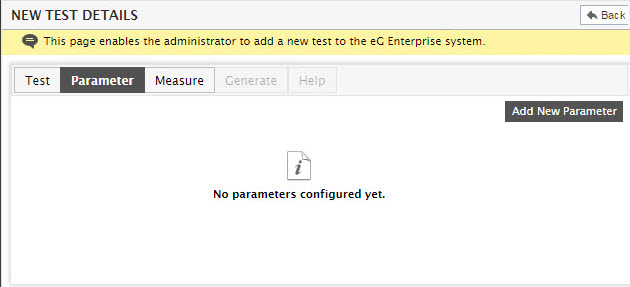
Figure 6 : The Parameter tab page
By default, any test you add using the Integration Console, will take Test period and Host as its parameters. While the Test period represents the frequency with which the test is to be run, the Host indicates the host on which the test should run. If the test is a port-based test, then, it will additionally take the Port number as its parameter. You will not be able to view any of these default parameters, and hence will not be able to modify or delete them.
Some tests however, may support more parameters than the default Test period, Host, and Port. Such parameters can be user privileges that a test may require for connecting to targets, filter conditions, pattern specifications etc. You can create these additional parameters for a new test using the Parameter tab page. For this, you will have to click the Add New Parameter button in Figure 6. This will invoke Figure 7, where you can specify the Parameter name and the Default value of the parameter.
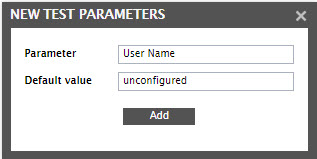
Figure 7 : Adding a new test parameter
Once a Default value is set here, then every time the test runs, it will automatically use this default value for all servers on which it runs. Therefore, when setting a Default value, make sure that the value you provide does not have to be changed at run-time according to the target server/environment.
If the value of the parameter varies with the target server/environment, then its best to leave the Default value as unconfigured. If this is done, then, once this test is mapped to a server and that server is managed in eG, the eG Enterprise system will explicitly prompt you to configure this parameter with a valid value before attempting to monitor that server. This way, you will be able to configure this parameter with the appropriate value at run-time and ensure that the test executes smoothly.
Note:
In addition to the default parameters bundled with every new test, eG Enterprise provides three ready-to-use parameters that can be, if required, configured for any new test added using the Integration Console. These parameters are, namely, executionTime, useMgrTime, and executeAtFixedTime. Typically, the executionTime parameter can be set for tests that need to execute at a specific time every day, or at the beginning of every hour. For instance, say, you want to add a new test that should trigger a ‘database cleanup’ process at 11 PM every day and alert administrators if the process fails to start at the set time. Such a test can take executionTime as one of its parameters, so that you can specify the exact time of the day at which the clean up process needs to begin. Similarly, if you want a test to execute at the beginning of every hour and report metrics, once again, you might want to use the executionTime parameter. While setting the testperiod as 1 hour can ensure that the test runs once every hour, it cannot guarantee that the test will run at the beginning of every hour. To add this parameter to a new test, specify executionTime in the Parameter text box of Figure 7. You can leave the Default value as unconfigured, as this parameter would typically expect user input.
If the executionTime parameter has been added to any new IC test, then, depending on need, you may want to use the useMgrTime parameter along with it. By default, as soon as the eG agent starts, it synchronizes time with the eG manager, and proceeds to report measures at the manager’s time. In MSP environments particularly, a single, central manager will be receiving performance data from managed customer environments across the globe - i.e., from agents operating in different time zones. By default, all these agents will run tests and report measurements at the manager’s time. This means, if an executionTime has been specified for one/more tests executed by these agents, and key maintenance processes are being triggered by these tests, such processes will run at the manager’s time and not the agent’s, thereby causing confusion. Therefore, whenever there is a time difference between the agent and manager zones, you will have to make sure that the test that supports the executionTime parameter runs according to the agent’s time and not the manager’s. To ensure this, you will have to additionally configure a useMgrTime parameter for the test. To add this parameter to an IC-based test, specify useMgrTime in the Parameter text box, and set the Default value to No. Also, note that the executionTime parameter can be added as a stand-alone parameter to any new IC-based test, but the useMgrTime parameter can only be used alongside the executionTime parameter.
The executeAtFixedTime parameter can be used if a test needs to run at a fixed interval (in hours), starting from ‘midnight’ every day. For instance, you may have written a test to check whether/not a virus scanner runs at 12 AM and every 3 hours thereafter, every day. To make sure that the test runs at this exact frequency, first integrate the test into the eG Enterprise system via IC, and when doing so, specify executeAtFixedTime as a Parameter of the test; then, set Yes as its Default value. Later, when configuring this test for a component, make sure that you set the Test period as 3 hours. Typically, eG Enterprise computes a test’s frequency based on when the eG agent executing that test was started. In the case of this test however, since the executeAtFixedTime parameter is set to Yes, the eG agent uses 12 AM (midnight) as the base for computing the test frequency, regardless of when it (i.e., the eG agent) was started. This ensures that the test runs every 3 hours from midnight – i.e., at 3 AM, 6 AM, 9 AM, 12 PM, 3 PM, 6 PM, 9 PM, 12 AM, and so on! Moreover, in this case, even if the eG agent is restarted in-between – say, at 2.30 PM – it will run the test at 3 PM as originally scheduled, and not at 5.30 PM (which is 3 hours from the time the eG agent was started). When using the executeAtFixedTime parameter however, make sure that the Test period is only set in hours and is set to a number that is a factor of 24 – i.e., it can only be 1, 2, 3, 4, 6, 8, 12, or 24 hours. This is because, this parameter computes the test frequency using the ’24-hour’ time format.
In our example, the MsFileTest_ex does not require any parameters to obtain the statistics of interest. Therefore, proceed to configure the measures to be reported by the test, by clicking on the Measure tab page in Figure 6. Since measures are yet to be configured for the MsFileTest_ex, you will find a message to that effect in Figure 8 that appears.
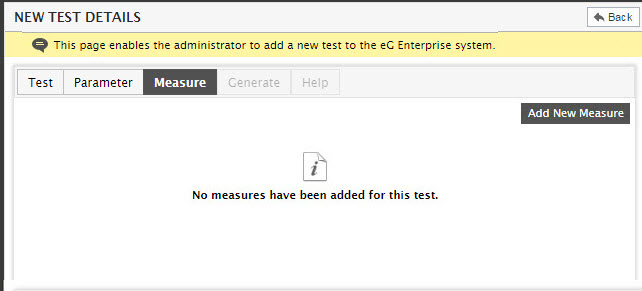
Figure 8 : The Measure tab page indicating that measures are yet to be configured for the MsFileTest_ex
Click the Add New Measure button in Figure 8 to add a new measure. Figure 9 will then pop-up, using which you can create a new measure.
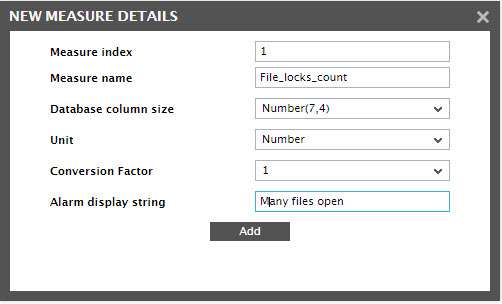
Figure 9 : Adding a new measure
The Measure name field indicates the name of the measurement (this will be displayed in eG’s monitor interface), while the Unit (whether %, seconds, requests/sec, etc.) specifies the unit in which the measurement’s value is reported. The Database column size field indicates the size of each database record corresponding to a measurement value. For example, Number(7,4) indicates that the output of the measurement will be a number in the range 0 to 100, with the fractional value being limited to four decimal places. The Measure index determines the order in which the measures are to be displayed in the monitor console. For example, if 1 is the Measure index, then the corresponding measure will appear first in the list of measures displayed in the monitor console. This index is automatically generated by the eG Enterprise system, and cannot be edited by the user. In our example, the Measure index of the measure File_locks_count is 1.
Sometimes, administrators may want to convert the unit of measurement of a performance metric before displaying the same in the eG monitoring console. For instance, a duration value originally available in ‘milliseconds’ may have to be changed to ‘Secs’ before it is displayed in the console. If you want the unit of the measure being added to be so converted at test run time, then select a Conversion Factor from the list. For example, if a value in ‘milliseconds’ needs to be converted to ‘seconds’, then select /1000 as the conversion factor. By default, 1 is chosen as the Conversion Factor; this implies that, by default, unit conversion does not take place for a new measure at test run time.
The Conversion Factor list comes with a default set of conversion factors. You can however, override this list by adding more conversion factors. For instance, the default Conversion Factor list does not provide the option to convert Bytes to MB at run time. To include this option in the list, follow the steps below:
- Edit the eg_ui.ini file in the <EG_INSTALL_DIR>\manager\config directory.
- To include a new conversion factor, you will have to append an entry of the following format to the [conversion_factors] section of the file:
- DisplayName=Value
-
For instance, to support ‘Bytes to MB’ conversion, append the following entry to the [conversion_factors} section:
/1048576 (Bytes to MB)=0.00000095367431640625
- In this case, the DisplayName, /1048576 (Bytes to MB), will be displayed as an option in the Conversion Factor drop-down list. If this option is chosen, then, at test run time, the conversion value of 0.00000095367431640625 will be multiplied with the actual measure value that is reported in Bytes to convert it into MB. Care should be taken while specifying the conversion value, as incorrect values will result in wrong measures being reported by the test.
- Once the new entry is appended to the [conversion_factors] section, save the file.
- Finally, restart the manager.
Once this is done, you will find the string /1048576 (Bytes to MB) appear as an option in the Conversion Factor list.
When configuring a measurement for a custom test, also specify the text string that must be displayed in the eG alarm window when the corresponding measurement violates its threshold. This is only an optional field. For our example, however, let us specify an appropriate Alarm display string (see Figure 9)
By clicking on the Add button in Figure 9, the first measurement of the MsFileTest_ex can be added. To add more measures, click the Yes button in the message box (see Figure 10) that appears subsequently.
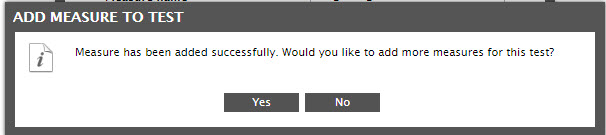
Figure 10 : A message box requesting you to confirm whether/not you want to add more measures for the MsFileTest_ex
This will once again open the new measure details pop-up, using which you can configure the second measure – i.e., the Unique_users_count measure - of the MsFileTest_ex (see Figure 11)
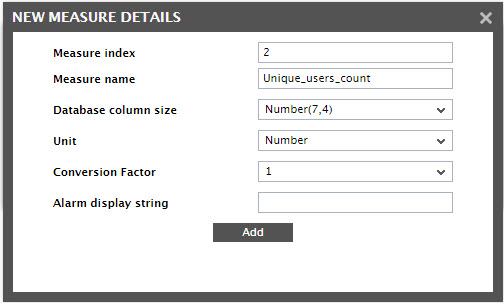
Figure 11 : Adding the second measure of the MsFileTest_ex
If you click on the Add button in Figure 11, the message box of Figure 10 will re-appear. Since no more measures need be added for the MsFileTest_ex, this time, click the No button in the message box to end measure configuration.
Doing so will instantly lead you to the Generate tab page, where you will have to specify the implementation of the test. All Custom tests that are newly added to eG have to be implemented in Java. The later sections of this chapter will describe how the eG test generator API can be used to implement new tests.
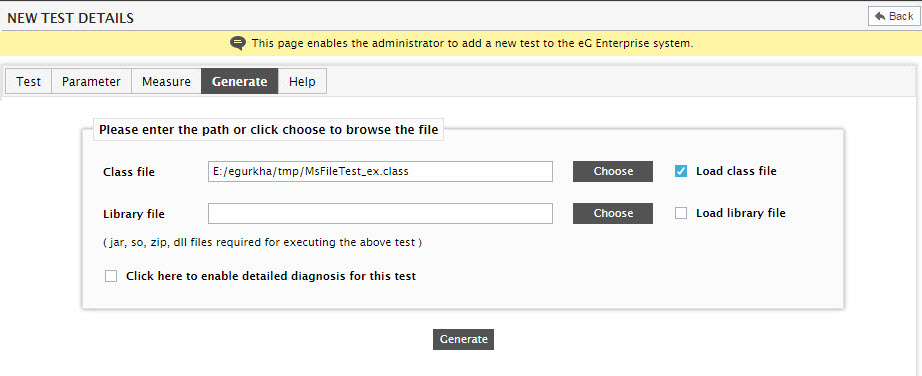
Figure 12 : Specifying a test’s implementation
Figure 12 shows how a new test can be added to eG Enterprise after it has been configured. After all the measurements of the test have been specified, the directory in which the test’s implementation exists should be specified in the input box corresponding to the Class file specification. The test implementation must exist in a Java class file with the same name as the test name – e.g., the implementation of MsFileTest_ex must exist in a class file named MsFileTest_ex.class.
If the class file is present in a remote location, then you can upload it to the eG manager, by clicking on the Choose button adjacent to the Class file text box. This will invoke a pop-up window using which you can Browse for the class file and specify its location (see Figure 13).
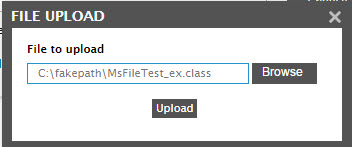
Figure 13 : Uploading the class file to the eG manager
Finally, click on the Upload button in the pop-up window (see Figure 13), to upload the class file in the remote location to the eG manager. If the class file has already available on the eG manager system, just specify the location of the file against the Class file text box. Some class files may require certain library files (eg., “.jar” or “.so” (shared object files) files) for their execution. The name of the file along with the directory in which these files exist has to be specified in the Library file specification. Please note that the size of these files should not exceed 0.5 MB in order to prevent excessive load while uploading. If the library file is present in a remote location, then you can upload it to the eG manager, by clicking on the Choose button adjacent to the Library file text box. Note that the Load class file check box should be selected if the class file has to be loaded every time the test is implemented. The Load library file check box should be selected if the library file has to be loaded every time the test is implemented.
Since in this example, the MsFileTest_ex need not be configured with any detailed diagnosis capability, leave the Click here to enable detailed diagnosis for this test check box in Figure 12 unchecked. Once the class and library files are specified, click the Generate button to generate the test.
Clicking on Generate invokes Figure 14, where you can view the measures that have been configured for the MsFileTest_ex. You can set default thresholds for a measure by clicking on that measure in Figure 14.
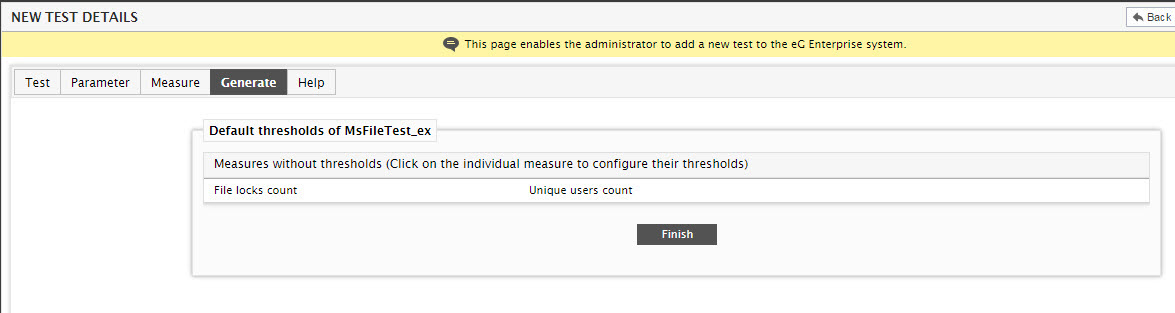
Figure 14 : Viewing the measures of the MsFileTest_ex
Figure 15 will then appear, which will help you configure the thresholds for the chosen measure.
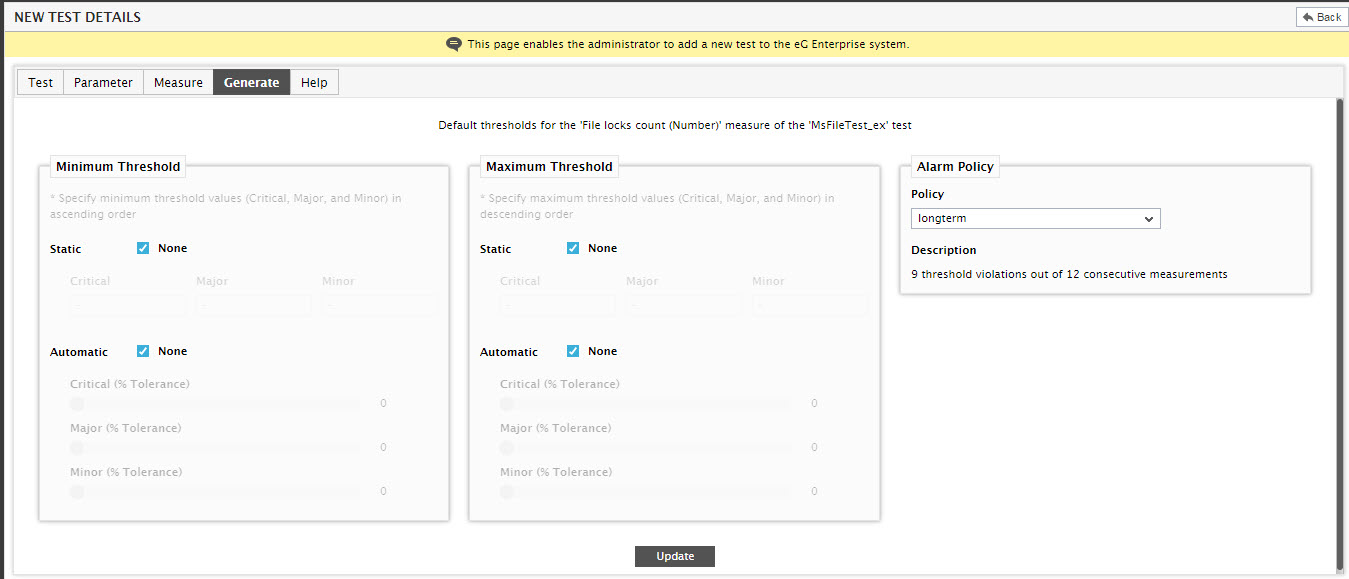
Figure 15 : Configuring the thresholds for a measure of the MsFileTest_ex
Configuring Detailed Diagnosis for a Custom Performance Test
To make diagnosis more efficient and accurate, eG Enterprise embeds an optional detailed diagnostic capability. With this capability, the eG agents can be configured to run detailed, more elaborate tests as and when specific problems are detected. Alternatively, these tests can also be run periodically for proactive monitoring purposes.
If required, you can also configure a custom test to report detailed diagnostics. To lend this capability to the MsFileTest_ex in our example, you will have to select the Click here to enable detailed diagnosis for this test check box in the Generate tab page, when configuring the test’s implementation (see Figure 16).
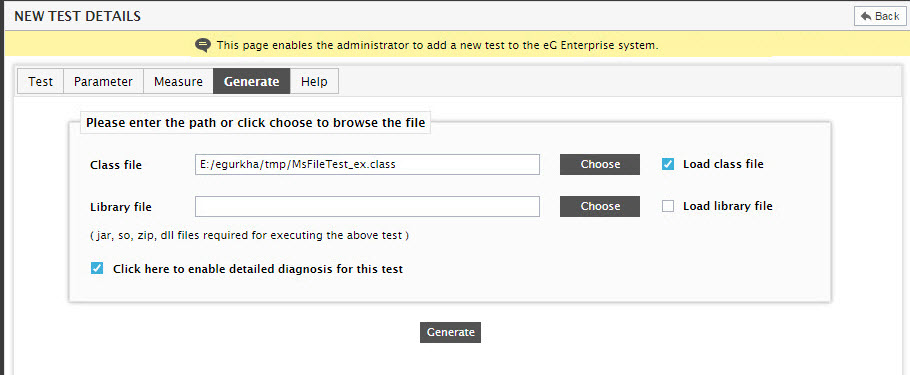
Figure 16 : Configuring detailed diagnosis for the MsFileTest_ex
Note:
The option to enable the detailed diagnosis capability for an IC test will be available only if the following conditions are fulfilled:
- The eG license should enable the detailed diagnosis capability
- Both the normal and abnormal detailed diagnosis frequencies should not be 0. For more information on configuring these frequencies, refer to Configuring Detailed Diagnosis.
Finally, click the Generate button in Figure 16. This will introduce a new Detailed Diagnosis tab page in the new test details page (see Figure 17).
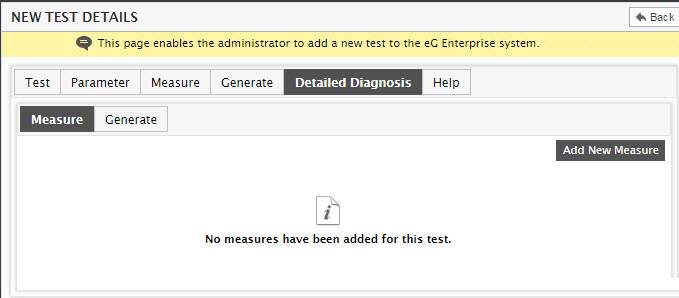
Figure 17 : The Detailed Diagnosis tab page
The Detailed Diagnosis tab page provides two sub-tabs, namely, Measure and Generate. Since the detailed diagnosis capability has not yet been configured for any measure of the MsFileTest_ex, the Measure tab page will only display a message to that effect. To indicate for which measure of the MsFileTest_ex detailed diagnostics should be reported and what type of information should be collected as part of the detailed diagnostics, click the Add New Measure button in Figure 17.
When Figure 18 appears, select the measure for which detailed diagnostics are required from the Measures for this test drop-down list. For our example, let us configure the File_locks_count measure of the MsFileTest_ex to provide a detailed diagnosis that will reveal the list of open files in the network. Therefore, select File_locks_count from the list. Next, provide a comma-separated list of Column headings under which the detailed diagnosis information will be displayed in the eG monitor interface (see Figure 18). Then, provide an appropriate Description of the detailed diagnosis that will be displayed in the detailed diagnosis page of the eG monitor interface. Finally, click on the Add button in Figure 18 to apply the selection.
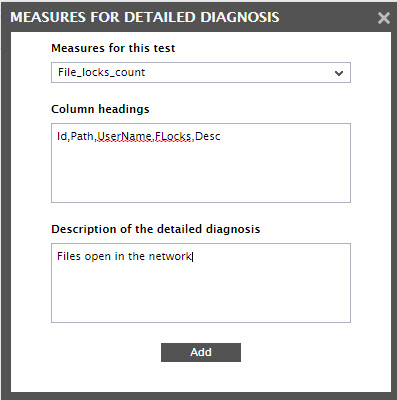
Figure 18 : Configuring detailed diagnosis for the File_locks_count measure of the MsFileTest_ex
A summary of the specification will then be displayed (see Figure 19). You can either Modify the specification or Delete it using the buttons provided therein.
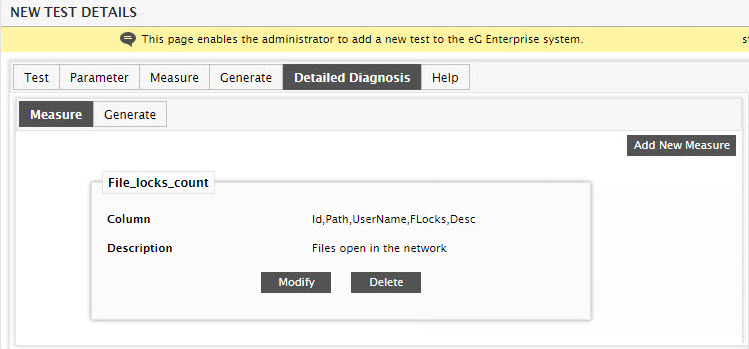
Figure 19 : A summary of the detailed diagnosis specification of the MsFileTest_ex
If you want to proceed with the displayed specifications, simply click the Generate sub-tab in Figure 19 to specify the implementation of the detailed diagnosis.
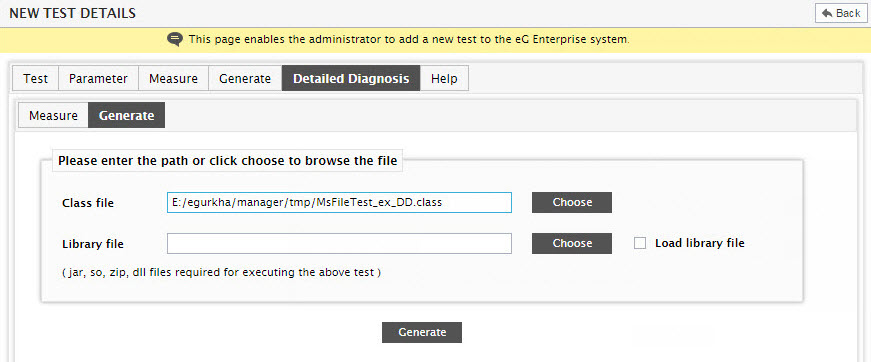
Figure 20 : Specifying the detailed diagnosis implementation
The detailed diagnosis implementation must exist in a Java class file whose name is the test name suffixed with “_DD” - e.g., the implementation of detailed diagnosis for the MsFileTest_ex must exist in a class file named MsFileTest_ex_DD.class. The path to this class file has to be mentioned in the Class file text box in Figure 20. If the file exists in a remote location, then click on the Choose button adjacent to the text box to upload the file to the eG manager.
As before, specify any library files using the Library file specification (see Figure 20).
Finally, click the Generate button in Figure 20 to generate the test.