How to Monitor Bitbucket Using eG Enterprise?
eG Enterprise monitors Bitbucket using an agentless approach. For this purpose, you need to install an eG agent on a remote Windows host in your environment. To enable the eG agent to collect the performance metrics of the Bitbucket user account, specify the credentials of that particular user while configuring the tests using eG admin interface.
The broad steps for monitoring the Bitbucket using eG Enterprise are as follows:
- Add the Bitbucket component using the eG admin interface;
- Configure the tests for the component.
In this discussion, each of the aforesaid steps will be elaborately dealt in the following sections.
Adding Bitbucket
To add the Bitbucket component, do the following:
- Login to the eG admin interface.
-
Click on the Add Component button in the right corner of the Components at a Glance page or follow the Infrastructure -> Components -> Add/Modify menu sequence.
- The Components page will then appear. In the Components page, select Bitbucket as the Component type and click the Add New Component button.
-
Figure 1 will then appear.
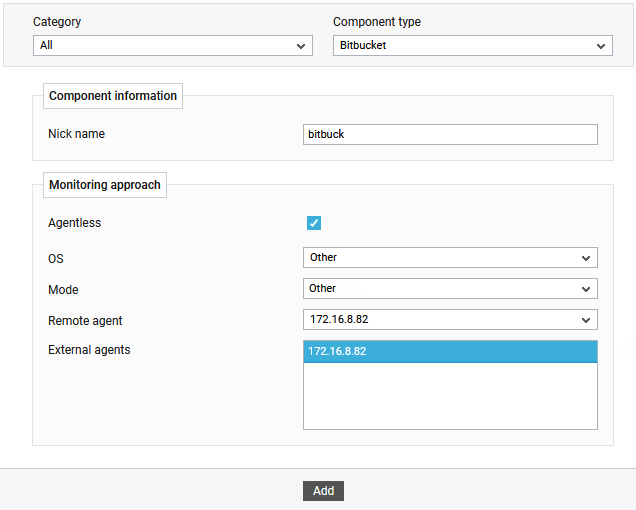
- Specify the Nick name for the component in Figure 1.
- Specify the Nick name for the Bitbucket component. Since the Bitbucket is hosted on the cluster environment, it can be monitored in an agentless manner alone.
- Therefore, the Agentless flag will be enabled by default.
- Set Other as the OS and Other as the Mode.
- Then, choose the Remote Agent that should do agentless monitoring of the Bitbucket component Figure 1.
- Next, assign a External Agent to the component.
- Finally, click the Add button to add the Bitbucket component to eG Enterprise. Components manually added will be automatically managed by eG Enterprise.
Configuring the tests
-
Once the Bitbucket component is added successfully, you will be again redirected to the Components page (see ). Using the options provided in the Components page, you can modify, unmanage or delete the newly added component. In addition, you can also configure the tests, set thresholds and maintenance policies, and change the IP address.
-
To collect the performance metrics, you may need to manually configure the tests that are mapped to the Bitbucket component. To configure the tests that need manual configuration, click on the
 icon in Components page. This will lead you to the Specific Test Configuration page where the unconfigured tests for the Bitbucket component will be listed in the Unconfigured Tests list box.
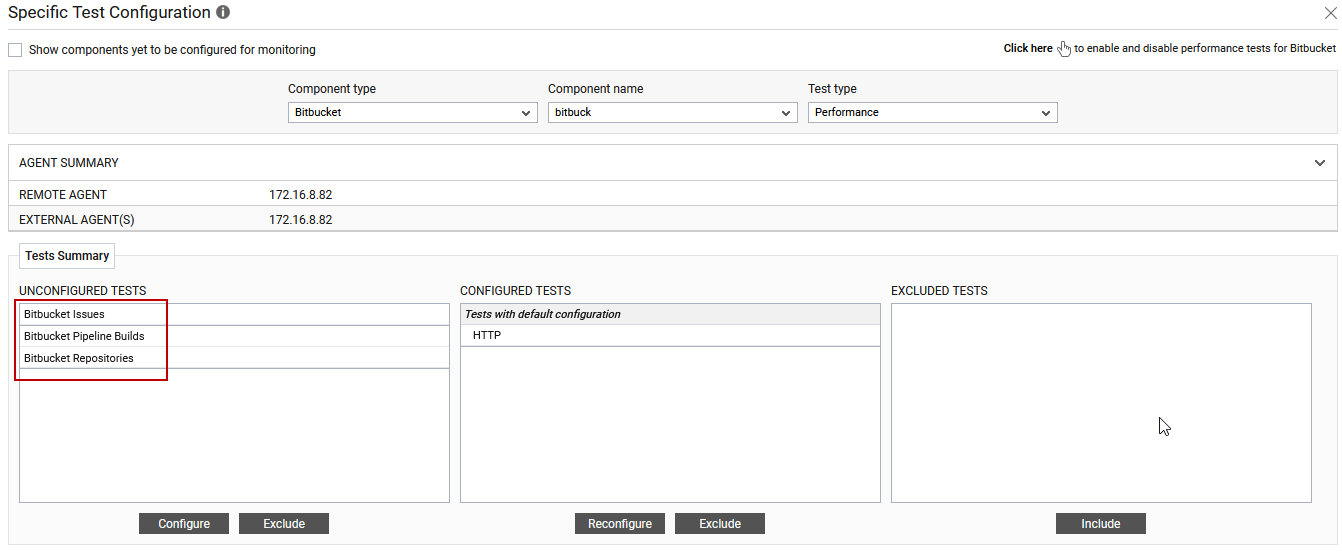
Figure 2 : Unconfigured tests for the Bitbucket component
- Now, click on any test to configure it. To know how to configure the tests, refer to the Monitoring Bitbucket. To view the performance metrics, switch to the Monitor tab.