How does eG Enterprise Monitor Boomi AtomSphere?
eG Enterprise monitors Boomi Atom using Boomi AtomSphere model in both agent-based and agentless manners. However, the recommended approach is agent-based manner. For agent-based monitoring, make sure that the eG agent is deployed on the Boomi AtomSphere and the eG agent pulls metrics from it using REST API, JMX calls (JVM) and using BTM profiler. This agent connects to the port of the target Boomi AtomSphere, runs REST API commands and pulls metrics from the target Boomi AtomSphere at regular intervals. The steps on how to configure JVM monitoring has been explained in Configuring JVM Monitoring for Boomi AtomSphere topic and the steps on how to configure BTM monitoring has been explained in Configuring BTM Monitoring for Boomi AtomSphere topic. Figure 1 shows the typical architecture of how Boomi is monitored by eG Enterprise.
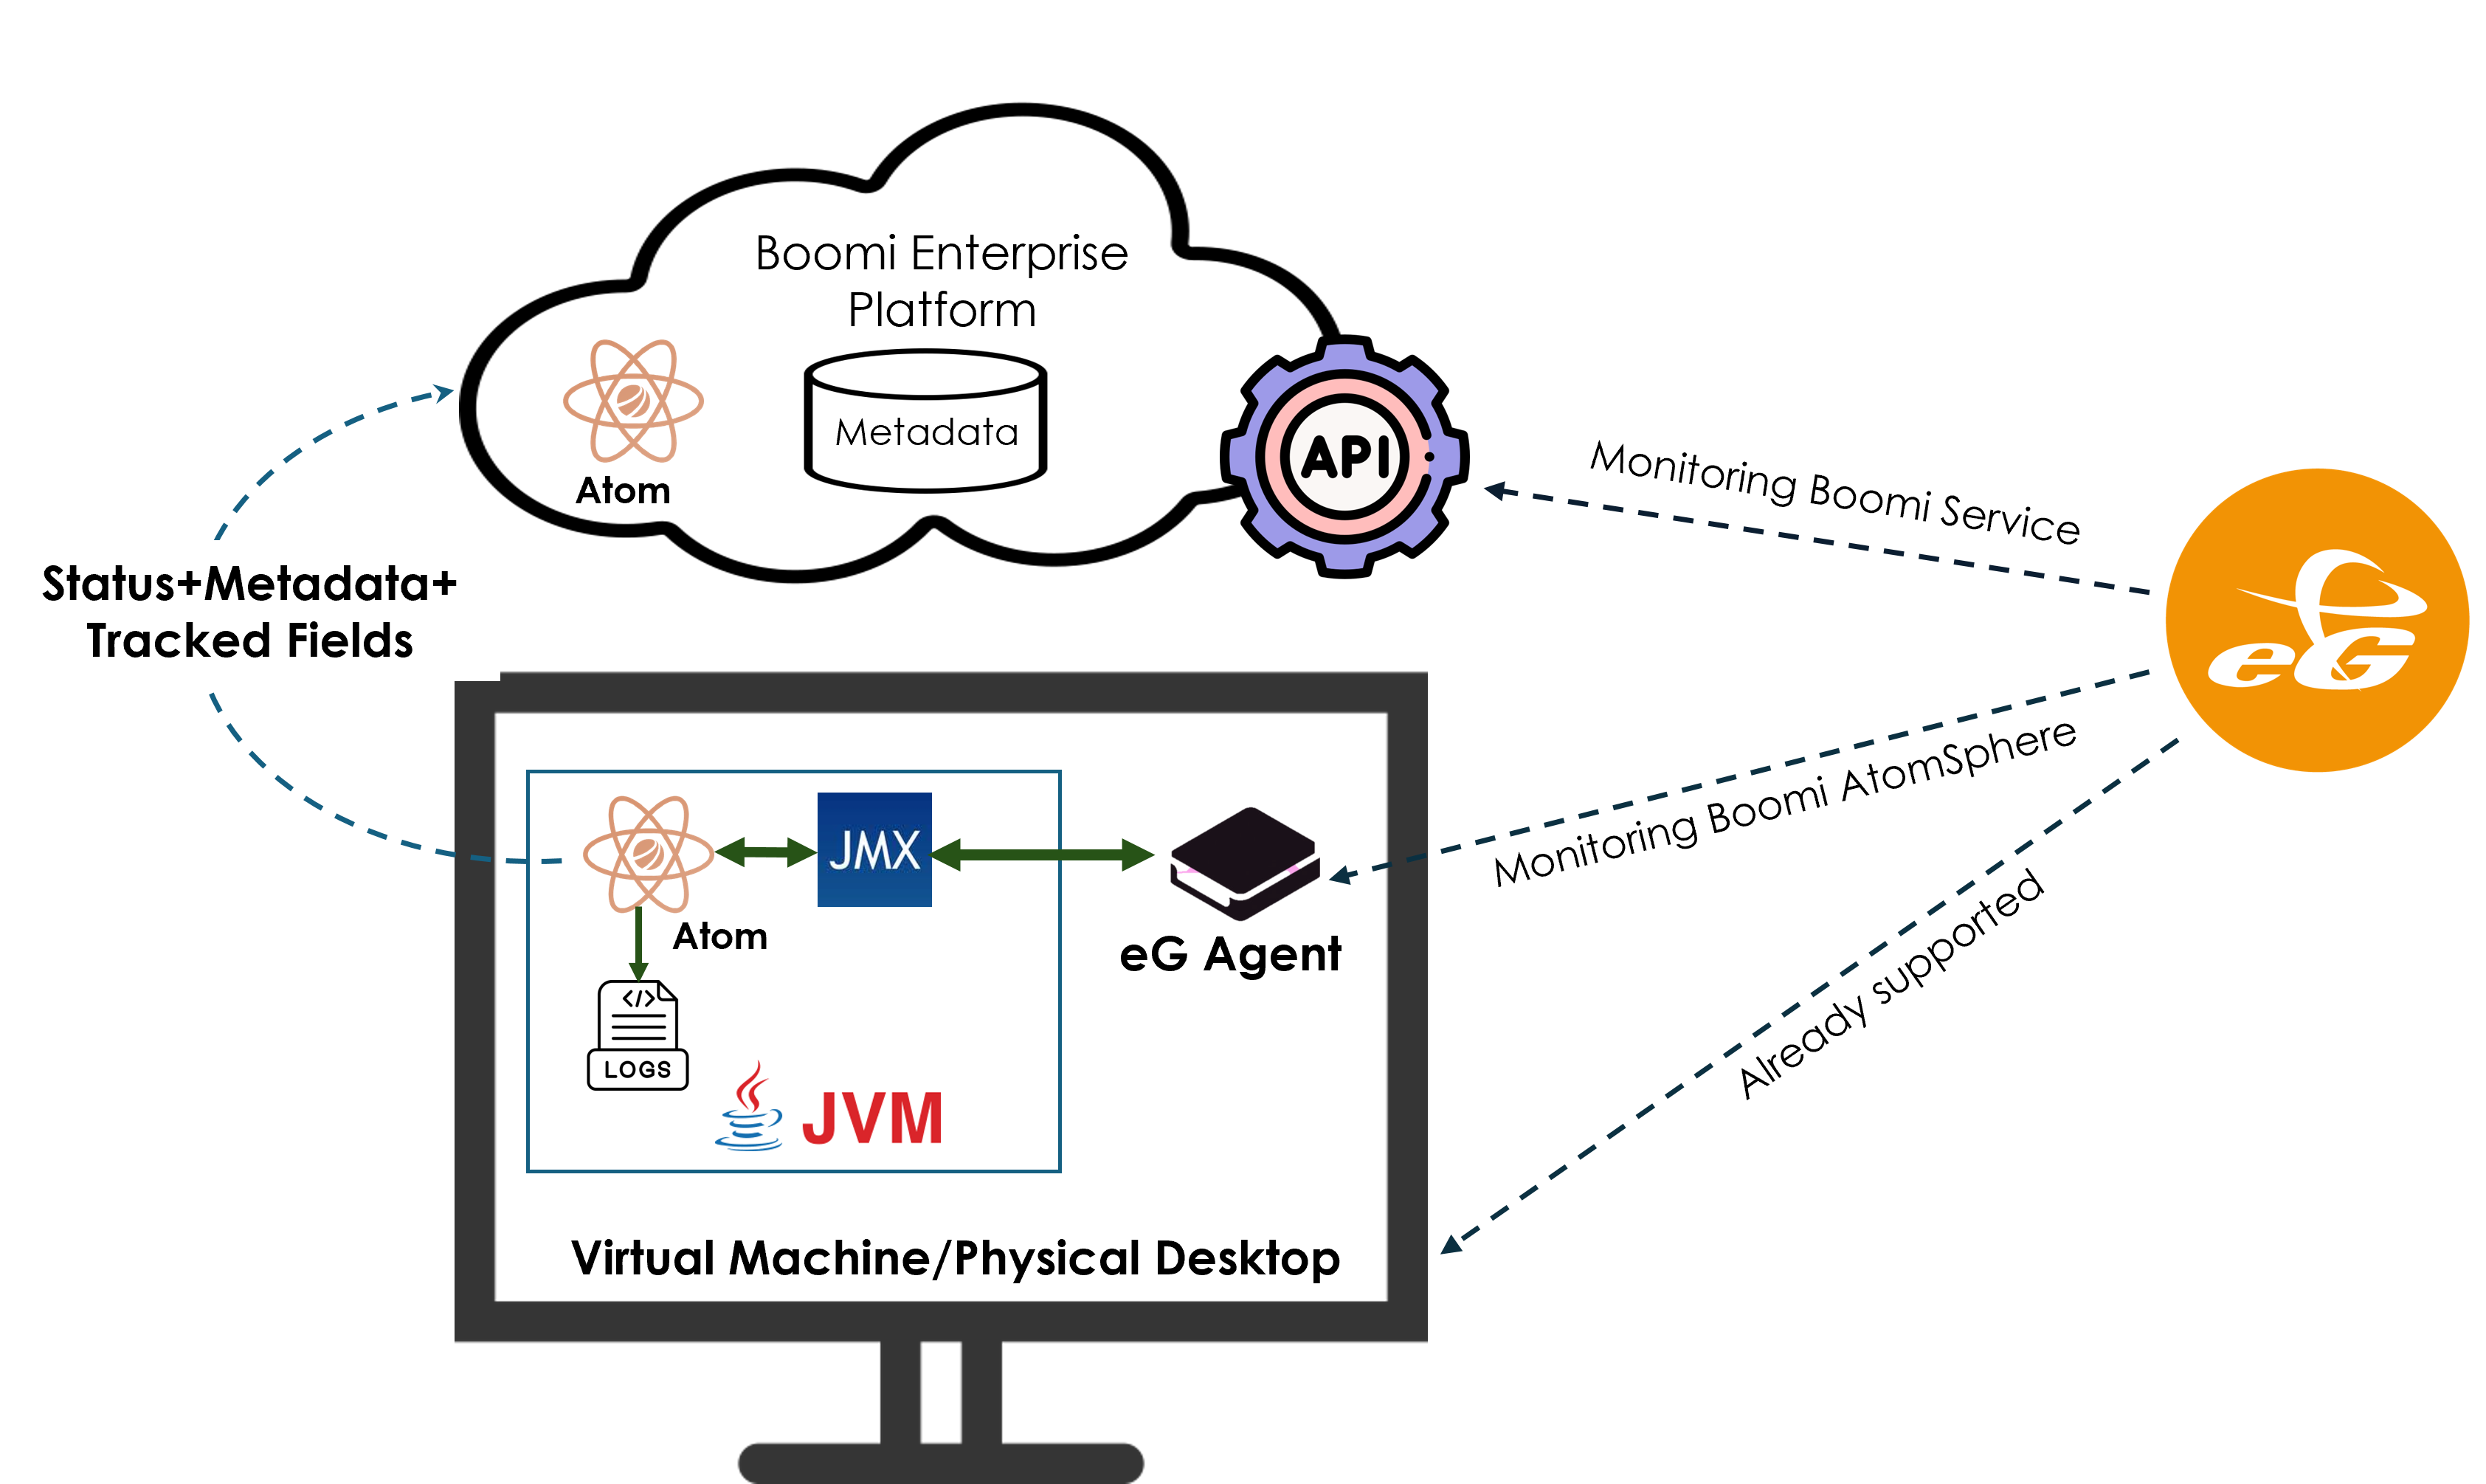
Figure 1 : Monitoring Boomi with eG Enterprise
Before attempting to manage and monitor Boomi AtomSphere, make sure that the following pre-requisites are fulfilled:
-
To collect the required metrics from the target Boomi AtomSphere, the eG agent should be able to connect to the port through which the target Boomi AtomSphere communicates.
-
In order to monitor Boomi AtomSphere, a special user account with Admin privilege has to be created for every Boomi AtomSphere instance that requires monitoring. To create a new user, refer to Creating Admin user role in Boomi console topic.
-
To fetch the API metrics from the target Boomi Service, the API Metrics/Dashboard Access and Data Collection options should be enabled in Boomi console. To enable both of these options, refer to Enabling API Metrics/Dashboard and Data Collection topic.
Creating Admin user role in Boomi console
The below steps guide you on how to create a new user on Boomi console.
-
Use https://boomi.com/URL to access the Boomi console. In the Boomi console, provide your username, business email address, and your profile details to register your user account in the Boomi console.
-
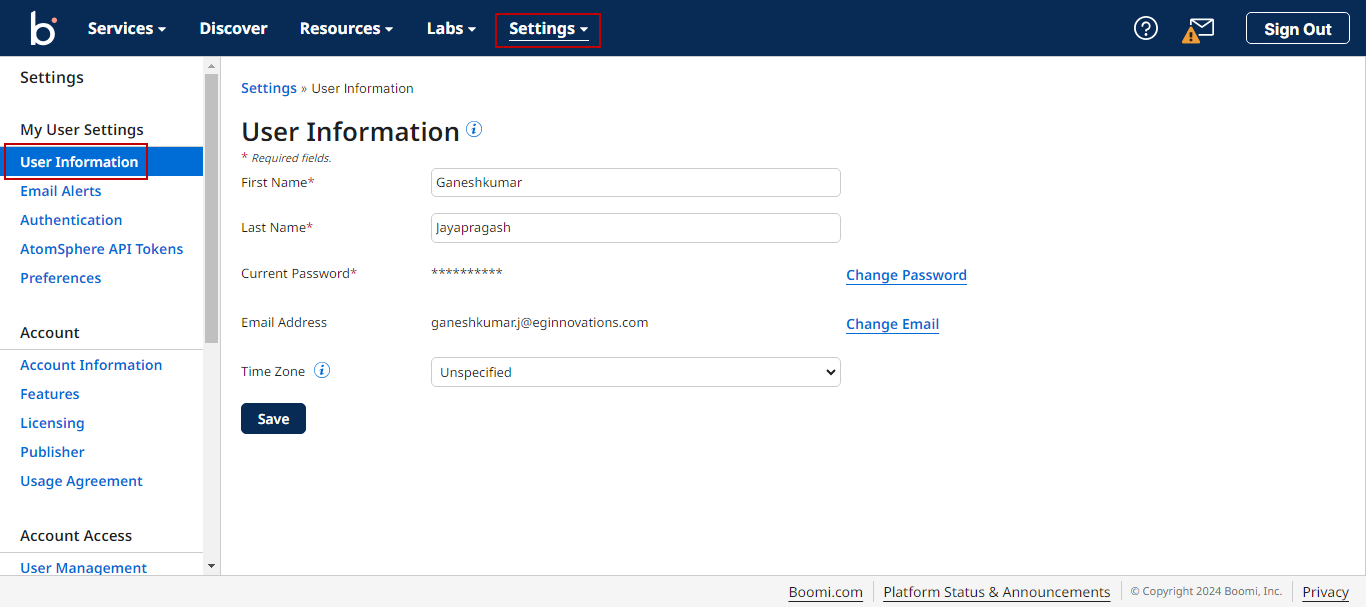
Once the user details are registered, an email will be triggered to your email ID for activating the user account with password. Log into the Boomi console with your username and password. In the Boomi console, click Settings tab and navigate to the User Information page by clicking the User Information menu in the left panel (see Figure 2).
-
The registered user details are shown in the User Information page (see Figure 2)
-
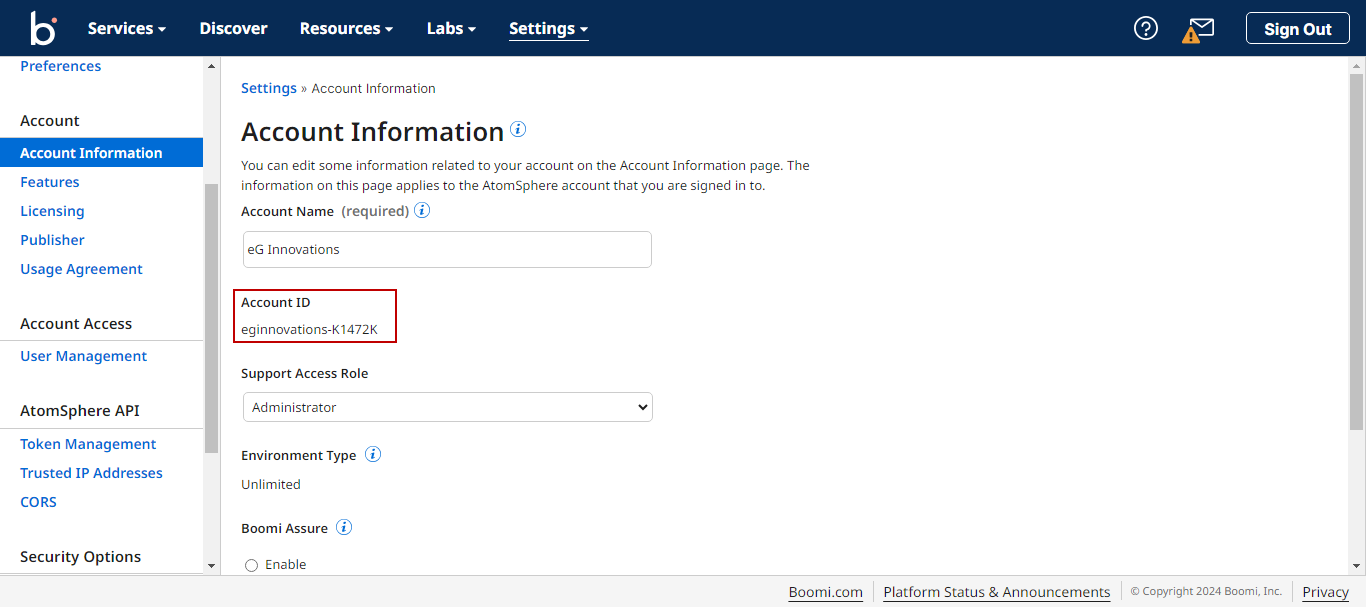
Once the user is created, an Account ID will be auto-generated in the Boomi console. The user can view the Account ID by navigating to Account Information page by clicking the Account Information menu in the left panel under Settings tab (see Figure 3).
-
The newly created user should be assigned with the role to monitor the Boomi Service and collect the metrics from it. The default user role applicable for monitoring the Boomi Service is Administrator role. By default, the Administrator role will be assigned in the User Management page and the user can view it by clicking the User Management menu under Settings tab (see Figure 4).

Enabling API Metrics/Dashboard and Data Collection
API Metrics provide valuable insights into how APIs are performing, including response times, throughput, and error rates. By enabling API metrics, the administrator can monitor the health of integrations and identify performance bottlenecks or failures.
Dashboards provide a visual representation of key performance indicators, easier to spot trends, understand system behavior, and address issues before they impact the end users or business processes.
By default, the API Metrics/Dashboard and Data collection services are disabled in Boomi console. To enable these services, ensure that the following steps are followed:
-
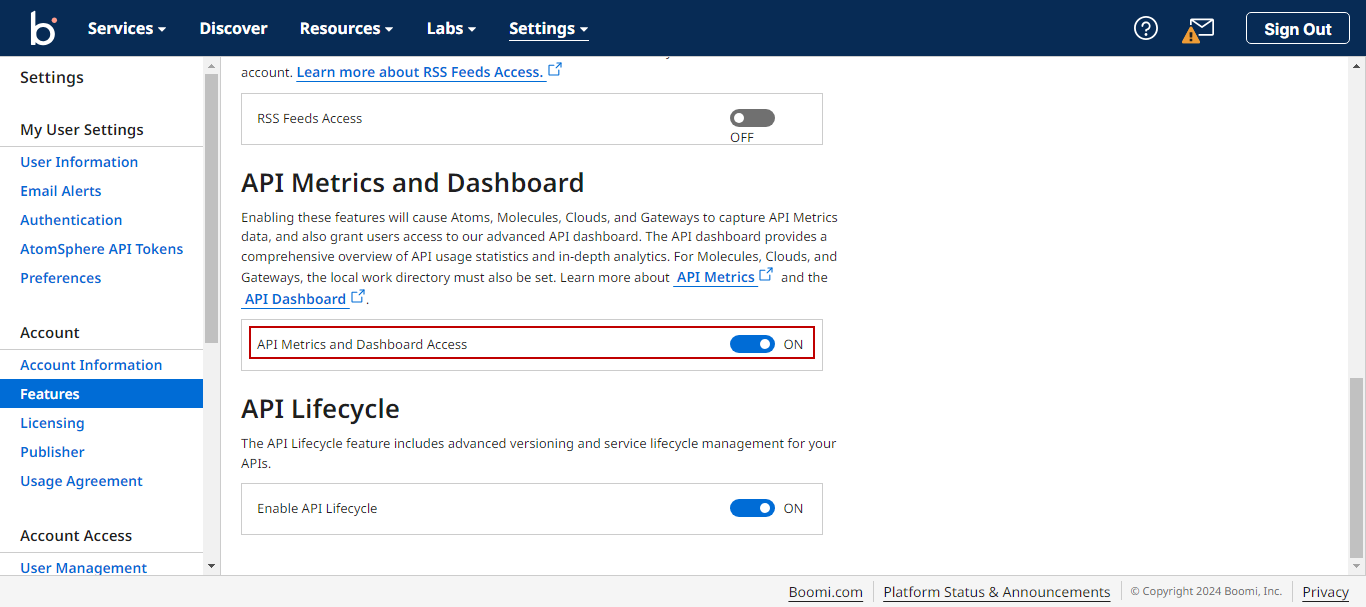
Click the Features menu in the left panel under Settings tab in Boomi console, the user will be navigated to Account Features page. The user can enable the API metric service by enabling the API Metrics and Dashboard Access option in API Metrics and Dashboard section (see Figure 5).
-
The user can also enable the API metric service by navigating to Services tab in Boomi console. Click the Properties menu in the left panel and enable the Capture API Metrics option in the Atom Properties page (see Figure 6).
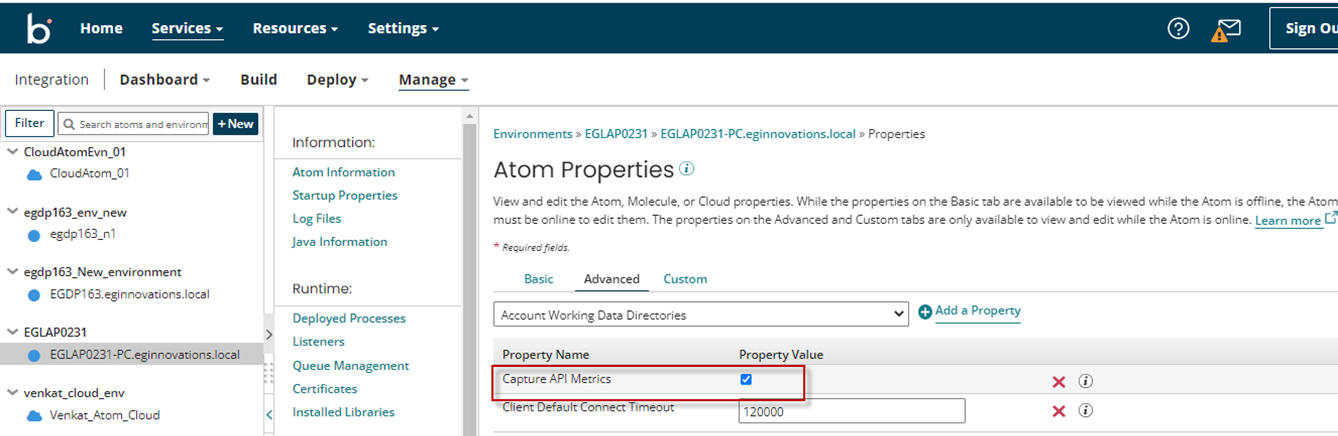
Figure 6 : Capture API Metrics option
Enabling this feature will cause Atoms, Molecules, Clouds, and Gateways to capture API Metrics data, and also grant users access to the advanced API dashboard.
-
Data collection allows Boomi to capture key metrics about the execution of the integration processes, such as processing times, data throughput, and success/failure rates. This data is essential for monitoring the health and performance of integrations, enabling the administrator to identify bottlenecks, failures, or areas for optimization in integration processes.
By default, the Data Collection option is disabled in Boomi console. Click the Features menu in the left panel under Settings tab, the user will be navigated to Account Features page. The user can enable the Data collection service by enabling the Data Collection option in Data Collection section (see Figure 7).
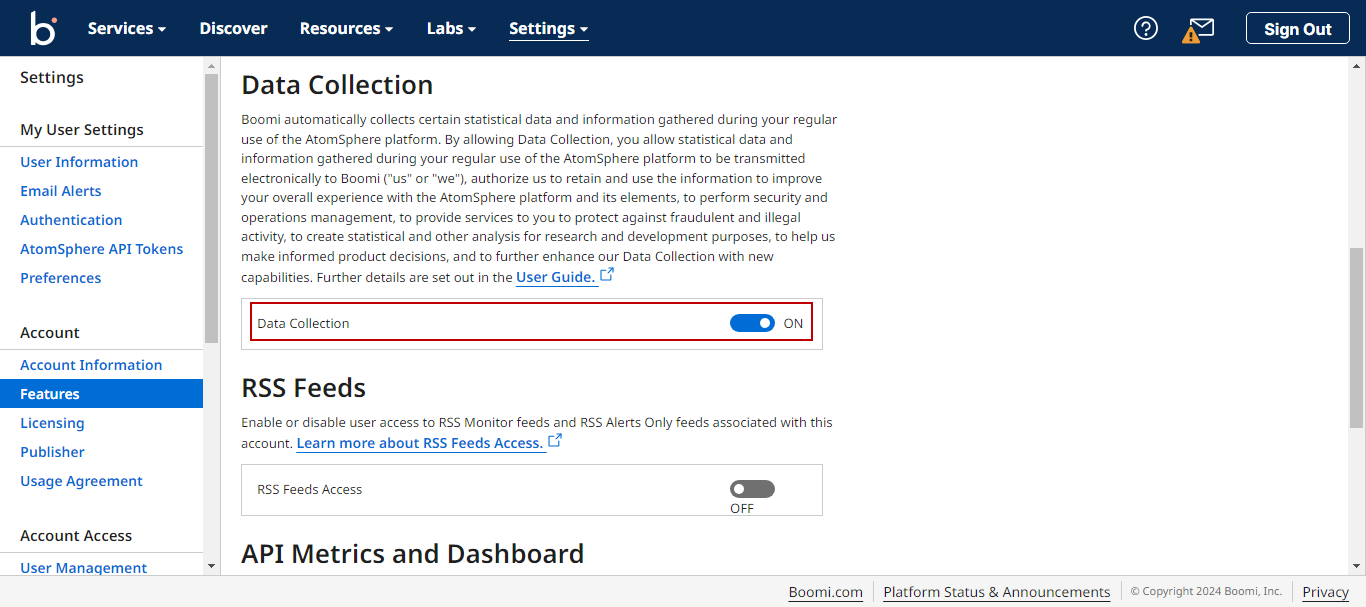
Figure 7 : Data collection service
By enabling Data Collection, the user allows statistical data and information gathered during regular use of the AtomSphere platform to be transmitted electronically to Boomi. This helps, authorize the users to retain and use the information to improve the overall experience with the AtomSphere platform and its elements, to perform security and operations management, to provide services to users, and to protect against fraudulent and illegal activity.
Gateway in Boomi enables secure communication between the Boomi Cloud and systems or data sources that are on-premises or behind firewalls. This allows the administrator to extend the reach of integrations to environments that do not have direct internet access, enabling cloud-based integration with on-premise systems.
If the Gateway is performing slower than usual or there are delays in processing integration tasks, a restart can help clear any issues and restore normal performance, especially after extended periods of high load or heavy data processing. The user should restart each Gateway after enabling or disabling API Metrics. If there are multi-node Gateways, Molecules, or Clouds, the user can add the following command com.boomi.container.localDir to enable the working data local storage directory.
Note: If the currently working data local storage directory is not configured, then the events will be reported as <base_dir>/<localhost_id>/events.
Note: Ensure that there is sufficient disk space available for collecting the metrics. Metrics requires approximately 1 KB per request, per day. Files roll over each day and be removed when not required.