Configuring BTM Monitoring for Boomi AtomSphere
eG Enterprise's Java Business Transaction Monitor (BTM) tracks individual transactions to Boomi AtomSphere in real-time, captures the time taken by each transaction, traces the journey of each transaction and the path it takes, and accurately pinpoints where and why a transaction had slowed down. To collect BTM-related metrics, the eG agent connects to the Boomi AtomSphere via BTM.
The steps listed below explains on how to enable BTM metrics for Boomi AtomSphere component:
-
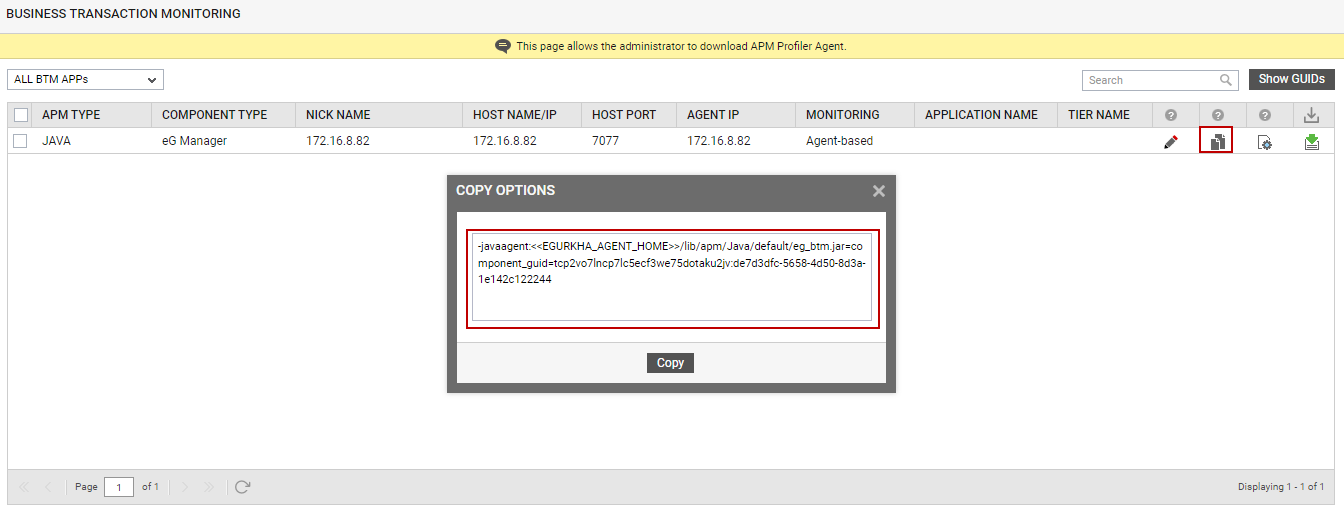
The BTM Profiler details help in identifying bottlenecks or inefficient stages in the integration processes, allowing the administrator to take corrective action (e.g., optimizing slow transformations, improving data mappings, etc.). BTM Profiler details can be retrieved by navigating to Admin -> Agents -> BTM Profiler Settings and on clicking the Copy Options button under BUSINESS TRANSACTION MONITORING page in eG Manager (see Figure 1). Copy the contents from the Copy Options window to any editor and paste the same in the Boomi AtomSphere console.
-
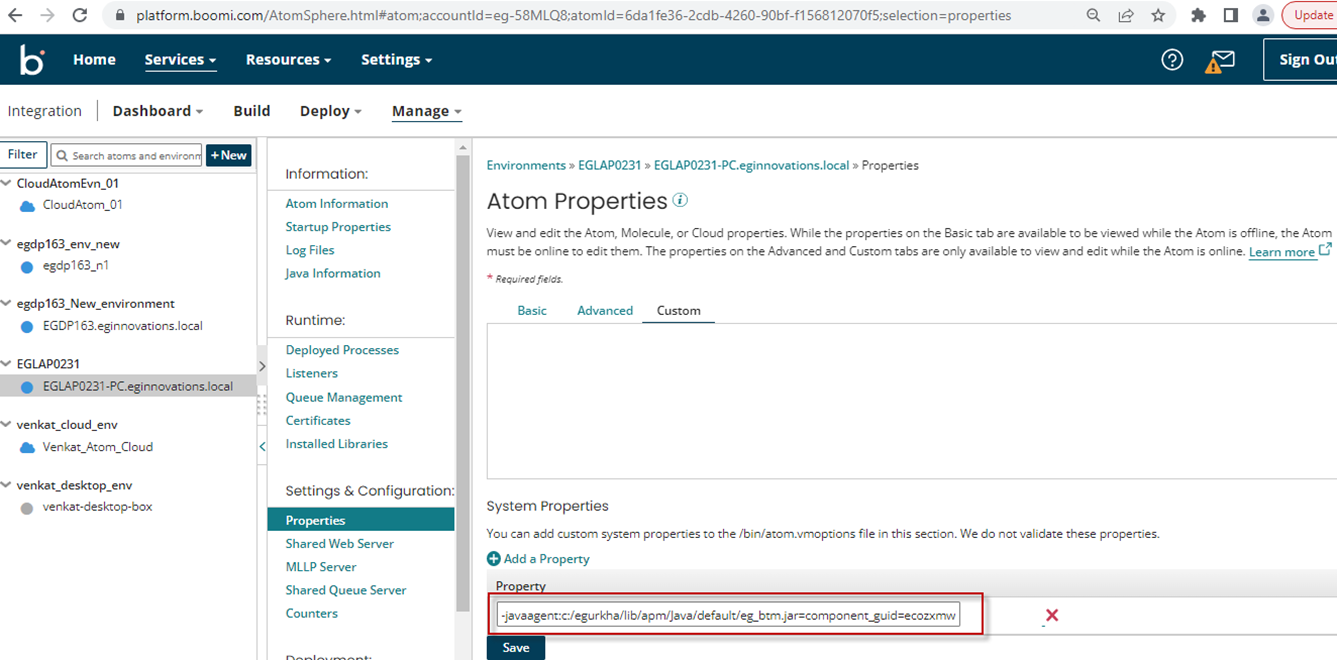
In the Boomi AtomSphere console, navigate through Manage -> Boomi Atom (on which you should enable Java BTM) -> Settings & Configuration -> Properties. Paste the copied JVM options copied from the eG Manager console in the Property text box in System Properties section.
-
Finally, save your configuration (see Figure 2), and restart the Boomi Atom service.
-