How does eG Enterprise Perform AppFlow Monitoring?
To intercept and process AppFlow records exported by NetScaler, eG Enterprise offers an eG AppFlow Collector. The collector runs as a Windows service. Once started, the collector service starts listening for AppFlow records on UDP port 9996 (by default). The ADC device in the target infrastructure should be configured to export AppFlow records to the collector. The collector receives these records, processes them, and stores the processed data in binary files.
To analyze and aggregate the data stored in the binary files, the eG remote agent monitoring the ADC device serves as the eG AppFlow Analyzer/Aggregator. This agent periodically reads these binary files, pulls statistics on appflow, processes/aggregates these statistics on the basis of HDX channels, users, applications, application/desktop sessions etc., and reports the aggregated data to the eG manager. The eG manager then stores this information in the eG database.
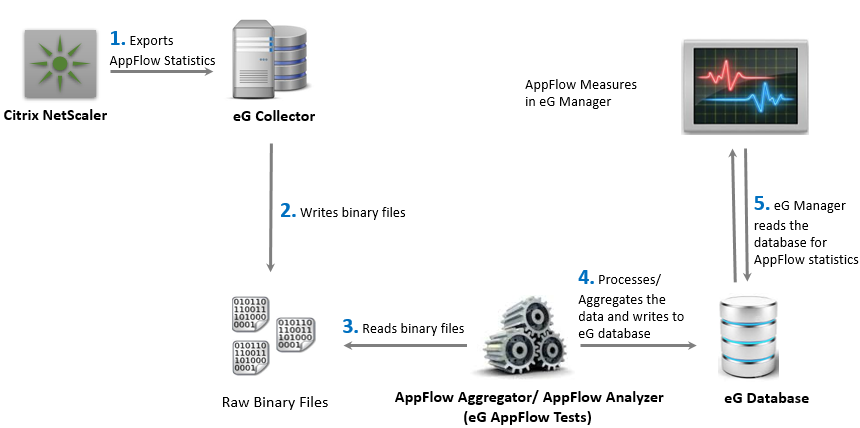
Figure 1 : How the eG NetFlow Collector Works
For a ADC device, the eG manager also presents real-time metrics on traffic and bandwidth in the eG monitoring console using a specialized Citrix ADC HDX AppFlow monitoring model. If abnormalities are spotted during flow analysis, alerts are generated on this model.
To know how to configure AppFlow monitoring using eG Enterprise, refer to Setting Up NetFlow Monitoring .
