HDX Desktops Summary Test
Periodically, administrators need to correlate the session load on their virtual desktop infrastructure with their network throughput to understand whether/not adequate network resources are available to handle the load. This is exactly what the HDX Desktops Summary test helps administrators achieve. This test reports the total number of sessions to the VDI infrastructure and the rate at which ICA traffic generated by those sessions is processed over the network. In the process, the test reveals whether/not sufficient bandwidth is available for handling the current and the anticipated session load. The test additionally reports the number and names of unique users to the virtual desktops, thereby indicating which users are contributing to the session load.
Target of the test : Citrix ADM HDX Insight
Agent deploying the test : A remote agent
Outputs of the test : One set of results for the virtual desktop infrastructure monitored
| Parameter | Description |
|---|---|
|
Test period |
How often should the test be executed. It is recommended that you set the test period to5 minutes. This is because, the Nitro API using which the eG agent collects metrics from HDX Insight, is capable of capturing only the performance data related to the last 5 minutes. |
|
Host |
The host for which the test is to be configured. |
|
Insight Username, Insight password, and Confirm password |
To connect to HDX Insight and collect the metrics it captures, the eG agent needs to be configured with the credentials of a user with read-only permissions to HDX Insight. Type the name of this user against insight Username and the password of this user against Insight password. Then, confirm the password by retyping it in the Confirm password text box. |
|
SSL |
By default, HDX Insight is not SSL-enabled. This is why, this flag is set to No by default. If it is SSL-enabled, then change this flag to Yes. |
|
DD Frequency |
Refers to the frequency with which detailed diagnosis measures are to be generated for this test. The default is 1:1. This indicates that, by default, detailed measures will be generated every time this test runs, and also every time the test detects a problem. You can modify this frequency, if you so desire. Also, if you intend to disable the detailed diagnosis capability for this test, you can do so by specifying none against DD Frequency. |
|
Detailed Diagnosis |
To make diagnosis more efficient and accurate, the eG Enterprise embeds an optional detailed diagnostic capability. With this capability, the eG agents can be configured to run detailed, more elaborate tests as and when specific problems are detected. To enable the detailed diagnosis capability of this test for a particular server, choose the On option. To disable the capability, click on the Off option. The option to selectively enable/disable the detailed diagnosis capability will be available only if the following conditions are fulfilled:
|
| Measurement | Description | Measurement Unit | Interpretation |
|---|---|---|---|
|
Avg bandwidth |
Indicates the average rate at which data is transferred over the ICA sessions. |
Kbps |
Ideally, the value of this measure should be low. A high value is indicative of excessive bandwidth usage. |
|
Unique users |
Indicates the number of distinct users to the virtual desktops. |
Number |
Use the detailed diagnosis of this measure to know the unique users to the VDI infrastructure. |
|
Total sessions |
Indicates the total number of sessions to the virtual desktops. |
Number |
This is a good indicator of the total load on the VDI infrastructure. |
Note:
This test will report the value 0 for all measures if no desktop sessions exist.
Using the detailed diagnosis of the Unique users measure, you can identify the unique users to the VDI infrastructure.
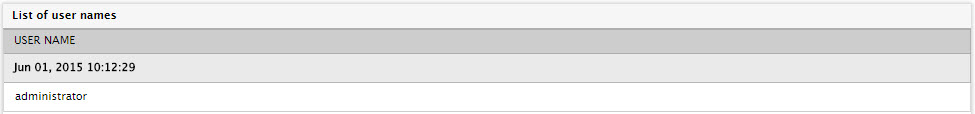
Figure 1 : The detailed diagnosis of the Unique users measure of the HDX Desktop Summary test