
Site Details - Cloud Test
A Site comprises of a delivery controller and the other core components such as machine catalogs, delivery groups, a Microsoft SQL database server, a license server, Citrix StoreFront/Receiver, Citrix Studio, etc.
This test promptly alerts administrators if it finds the following anomalies in a site:
- License is in grace period;
- DNS resolution is disabled;
- Trust requests are not sent to the XML service;
- The site is overloaded with sessions.
Target of the test : A Citrix Cloud Site
Agent deploying the test : A remote agent
Outputs of the test : One set of results for the site to which the managed cloud delivery controller belongs
| Parameter | Description |
|---|---|
|
Test Period |
How often should the test be executed. |
|
Host |
The IP address of the host for which this test is to be configured. |
|
Port |
Refers to the port at which the specified host listens to. |
|
Customer ID |
When configuring the Citrix Cloud service, you should have created an API client on the cloud, so that any external program can communicate with the cloud. This API client is tied to a customer ID. The Citrix Cloud API requires this customer ID, when calling REST APIs. To determine the customer ID that is mapped to the API client you created, refer to Determining the Customer ID Mapped to an API Client. |
|
Service Principal/Secure Client File Path |
When creating the API client on the cloud, you will be provided with an ID and a Secret for your client. Downloading this information saves a file named serviceprincipal.csv (if you have used Service Principal as an API client) or secureclient.csv (if you have used Secure Client as an API client). The eG agent uses the ID and Secret stored in this file to connect to the Citrix Cloud API. This is why, you should configure this test with the full path to the serviceprincipal.csv or secureclient.csv, as the case may be. Note: Before specifying the path of the secureclient.csv file, make sure that the API client is created and this file is downloaded by a valid Citrix cloud user with Read-only administrator rights to virtual apps/desktops. To know how to create this user on the cloud, refer to Before specifying the path of the serviceprincipal.csv file, make sure that the API client is created by a user with administrator rights to virtual apps/desktops and this file is downloaded by the administrator. To know how to create the Service principal as an API client on the cloud, refer to |
|
Proxy Host and Proxy Port |
If the Citrix Cloud Connector communicates with the Citrix Cloud via a proxy, then, you also need to configure the eG agent on the connector with the proxy server details. This will enable the eG agent to connect to the Citrix cloud without a glitch, and pull metrics. To facilitate this communication. do the following:
By default, both these parameters are set to none, indicating that the eG agent does not communicate with the Citrix Cloud via a proxy. Note:
|
|
Region Endpoint |
By default, US is chosen from this list indicating that this test will report metrics for those organizations whose users and resources are located in the United States region. Sometimes, the eG agent may collect the required metrics with a minor time delay due to the users and resources being monitored are in a different region. To avoid such time delays and to ensure end-user proximity and offer the best user experience, administrators are allowed to change the region based on where most of the users and resources are located. For instance, if the users and resources are located in the Asia-Pacific South region or approximately nearer to the Asia-Pacific South region, then, administrators need to choose 'AP-S' from this list. However, from this list, administrators are required to choose only the region that they had chosen when they signed in for the first time after onboarding their organization to the target Citrix Cloud. |
|
Detailed Diagnosis |
To make diagnosis more efficient and accurate, the eG Enterprise embeds an optional detailed diagnostic capability. With this capability, the eG agents can be configured to run detailed, more elaborate tests as and when specific problems are detected. To enable the detailed diagnosis capability of this test for a particular server, choose the On option. To disable the capability, click on the Off option. The option to selectively enable/disable the detailed diagnosis capability will be available only if the following conditions are fulfilled:
|
 icon provided at the right corner of that browser.
 | Measurement | Description | Measurement Unit | Interpretation | ||||||
|---|---|---|---|---|---|---|---|---|---|
|
Active sessions |
Indicates the total number of sessions that are currently active on this site. |
Number |
This measure is a good indicator of the load on this site. |
||||||
|
Is DNS resolution enabled? |
Indicates whether the DNS resolution is enabled or not on this site. |
|
The values and their corresponding numeric values that this measure could report are:
Note: By default, this measure reports the values Yes or No while indicating whether DNS resolution is enabled or not on this site. However, in the graph of this measure, the same will be represented using the corresponding numeric equivalents of 0 and 1 only. |
||||||
|
Is secure ICA required? |
Indicates whether/not a secure ICA is required for this site. |
|
By default, client-server communications are obfuscated at a basic level through the SecureICA feature, which can be used to encrypt the ICA protocol. Plug-ins use the ICA protocol to encode user input (keystrokes and mouse clicks) and address it to a server farm for processing. Server farms use the ICA protocol to format application output (display and audio) and return it to the client device. You can increase the level of encryption for the ICA protocol when you publish a resource or after you publish a resource. In addition to situations when you want to protect against internal security threats, such as eavesdropping, you may want to use ICA encryption in the following situations:
The values that this measure can report and their corresponding numeric values are:
Note: By default, this measure reports the values Yes or No while indicating whether a secure ICA is required for this site or not. However, in the graph of this measure, the same will be represented using the corresponding numeric equivalents of 0 and 1 only. |
||||||
|
Are trust requests sent to the XML service port? |
Indicates whether/not trust requests were sent to the XML service. |
|
Trusting requests sent to the XML Service means:
The values that this measure can report and their corresponding numeric values are:
Note: By default, this measure reports the values Yes or No while indicating whether/not trust requests were sent to the XML service. However, in the graph of this measure, the same will be represented using the corresponding numeric equivalents of 0 and 1 only. |
||||||
|
Total controllers on this site |
Indicates the total number of delivery controllers that are configured for this site. |
Number |
Use the detailed diagnosis of this measure to know which controllers are part of the site. |
||||||
|
Total connectors on this site |
Indicates the total number of cloud connectors in this site. |
Number |
Use the detailed diagnosis of this measure to know which connectors are operating in this site. |
||||||
|
Is connection leasing enabled? |
Indicates whether/not connection leasing is enabled for this site. |
|
To ensure that the Site database is always available, Citrix recommends starting with a fault-tolerant SQL Server deployment by following high availability best practices from Microsoft. However, network issues and interruptions may prevent Delivery Controllers from accessing the database, resulting in users not being able to connect to their applications or desktop. The connection leasing feature supplements the SQL Server high availability best practices by enabling users to connect and reconnect to their most recently used applications and desktops, even when the Site database is not available. Although users may have a large number of published resources available, they often use only a few of them regularly. When you enable connection leasing, each Controller caches user connections to those recently used applications and desktops during normal operations (when the database is available). The leases generated on each Controller are uploaded to the Site database for periodic synchronization to other Controllers on the Site. In addition to leases, each Controller’s cache holds application, desktop, icon, and worker information. The lease and related information is stored on each Controller’s local disk. If the database becomes unavailable, the Controller enters leased connection mode and “replays” the cached operations when a user attempts to connect or reconnect to a recently used application or desktop from StoreFront. Connections are cached for a lease period of two weeks. So, if the database becomes unavailable, the desktops and applications that the user launched in the previous two weeks remain accessible to that user through StoreFront. However, desktops and applications that have not been launched during the previous two-week lease period are not accessible when the database is unavailable. Connection leasing is enabled by default. You can turn connection leasing off or on from the PowerShell SDK or the Windows registry. This measure reports the value Yes if connection leasing is enabled for a site and the value No if connection leasing is not enabled for a site. The numeric values that correspond to these measure values are as follows:
Note: By default, this measure reports the values Yes or No while indicating whether/not connection leasing is enabled for the site. However, in the graph of this measure, the same will be represented using the corresponding numeric equivalents of 0 and 1 only. |
||||||
|
Is license in grace period? |
Indicates whether/not the license for this site is in the grace period. |
|
During the Supplemental Grace Period (SGP), the license policy engine will grant unlimited connections, for about 15 days to allow for fixing the issue. An alarm is activated when the grace period expires, and the Delivery Controller cannot checkout licenses to launch sessions from license server. After the expiration of SGP, regular license limits are enforced. If the license for the site is in the grace period, then the value of this measure will be Yes. If the license has not entered the grace period, then the value of this measure will be No. The numeric values that correspond to these measure values are as follows:
Note: By default, this measure reports the values Yes or No while indicating whether/not the site license is in the grace period. However, in the graph of this measure, the same will be represented using the corresponding numeric equivalents of 0 and 1 only. If this measure reports that the license is in grace period, then you may instantly want to know which license server the delivery controller is communicating with and the type of desktop and application licenses it manages . At this juncture, you can use the detailed diagnosis of this measure (if enabled) to ascertain the same. |
||||||
|
Is license in out of box grace period? |
Indicates whether/not the license grace period for this site has expired. |
|
If the license for the site has lived out its grace period, then the value of this measure will be Yes. If the license grace period has not expired, then the value of this measure will be No. The numeric values that correspond to these measure values are as follows:
Note: By default, this measure reports the values Yes or No while indicating whether/not the grace period of the site license has expired. However, in the graph of this measure, the same will be represented using the corresponding numeric equivalents of 0 and 1 only. |
||||||
|
License grace hours left |
Indicates how much time (in hours) is left for the grace period to expire. |
Hours |
This measure will report a value only if the value of the 'Is license in grace period?' measure is 'Yes'. If the value of this measure is low, then you may want to quickly install additional licenses on the site to ensure that your users receive uninterrupted access to their critical applications and desktops. Because, upon the expiry of the grace period, the delivery controllers in the site can not checkout licenses to launch sessions from license server. |
||||||
|
Is secondary delivery controller? |
Indicates whether this site contains secondary delivery controller or not. |
|
The numeric values that correspond to these measure values are as follows:
Note: By default, this measure reports the values Yes or No while indicating whether/not this site contains secondary delivery controller. However, in the graph of this measure, the same will be represented using the corresponding numeric equivalents of 0 and 1 only. |
||||||
|
Is local host cache enabled? |
Indicates whether the local host cache is enabled in this site or not. |
|
Local Host Cache is the most comprehensive high availability feature in XenApp and XenDesktop. The Local Host Cache (LHC) feature allows connection brokering operations in a XenApp or XenDesktop Site to continue when an outage occurs. An outage occurs when the connection between a Delivery Controller and the Site database fails. Local Host Cache engages when the site database is inaccessible for 90 seconds. The numeric values that correspond to these measure values are as follows:
Note: By default, the measure values reports the values Yes or No while indicating whether/not the local host cache is enabled. However, in the graph of this measure, the same will be represented using the corresponding numeric equivalents of 0 and 1 only. |
||||||
|
Is reuse machines without shutdown in outage allowed? |
Indicates whether the machines in this site can be reused without shutdown during outage. |
|
By default, power-managed desktop VDAs in pooled Delivery Groups are placed in maintenance mode when an outage occurs. Once the outage is resolved, the desktop will be shutdown and then made available for use. You can change this default behavior, by enabling LHC and setting the ReuseMachinesWithoutShutdownInOutageAllowed to "true". As a result, the desktop VDAs will be reused without shutdown during the outage. The numeric values that correspond to these measure values are as follows:
Note: By default, this measure reports the values Yes or No while indicating whether/not the machines are allowed to be reused without shutdown during outage. However, in the graph of this measure, the same will be represented using the corresponding numeric equivalents of 0 and 1 only. |
||||||
|
Total unique users |
Indicates the total number of unique users to this site. |
Number |
|
||||||
|
Peak concurrent users |
Indicates the high watermark of concurrent license users in this site. |
Number |
|
The detailed diagnosis of the Is license in grace period? measure displays the name of the License server in the site and the port at which it listens. Alongside, the detailed diagnosis displays the desktop model, desktop edition, application model and application edition that is compatible with the license. The date on which the license would finally expire/the last date for renewal of the license is provided in the REQUIRED SA DATE column. This information enables to determine when the license is likely to expire, and accordingly plan to renew it.
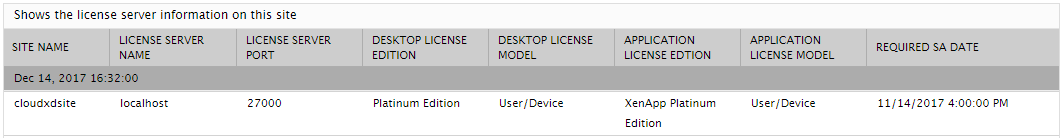
Figure 1 : The detailed diagnosis of the Is license in grace period? measure
The detailed diagnosis of the Total controllers on the site measure displays the names of the delivery controllers on this site. For each controller, the detailed diagnosis additionally reveals the machine on which that controller is installed, the total number of desktops managed by the controller, the state of the controller, the version of the controller, the type of operating system, the version of the operating system, the last time at which the controller was active, and the zone to which the controller belongs. This information helps you to identify the controllers that are inactive.
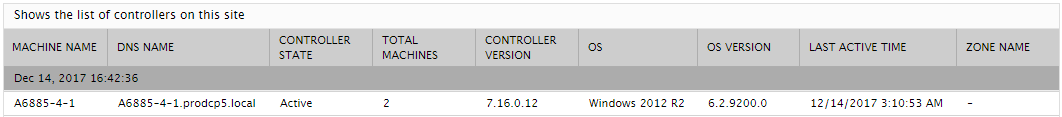
Figure 2 : The detailed diagnosis of the Total controllers on this site measure
Use the detailed diagnosis of the Total connectors on this site measure to know which cloud connectors are operating in the site.
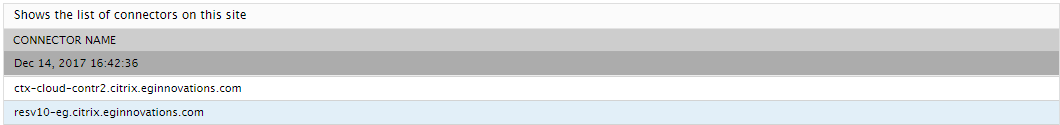
Figure 3 : The detailed diagnosis of the Total connectors on this site measure
