Applications Test
With XenDesktop 7, you provide users with access to information by publishing the following types of resources that can be virtualized on servers or desktops:
- Applications installed on servers running Delivery Controller - 5. When users access them, the published applications appear to be running locally on client devices.
- Streamed applications installed in application profiles and stored on a file server in your App Hub. Users access the profile and virtualize the applications on their client desktops.
- Data files such as Web pages, documents, media files, spreadsheets, and URLs. In XenApp, the combined total of data types you publish is referred to as content.
- The server desktops, so users can access all of the resources available on the server.
All these types of resources are called Published applications.
Whenever users to a virtual desktop complain that they are unable to access one/more published applications, administrators should be able to quickly troubleshoot and figure out the reason for this – is it because the application is disabled on the site? Or is it because the application is not even visible to users?
In addition, administrators should also be able to periodically check how popular an application is (in terms of usage) and accordingly reset its CPU priority level, so that such applications always command more CPU resources and users have no problems accessing or continuously using such applications.
The Applications test enables users to perform these checks. This test points administrators to applications that are currently enabled on the site and those applications that are not visible to the users. In addition, this test reports the number of instances of an application that is currently running and the CPU priority level of each application, so that administrators can accurately isolate popular applications and their CPU priority level.
Target of the test : A Citrix Delivery Controller 7.x
Agent deploying the test : An internal agent
Outputs of the test : One set of results for each application that is to be monitored.
| Parameter | Description |
|---|---|
|
Test Period |
How often should the test be executed. |
|
Host |
The IP address of the host for which this test is to be configured. |
|
Port |
Refers to the port at which the specified host listens to. By default, this is 80. |
|
Username |
In order to monitor the target Delivery Controller 7, eG requires a special user with the following privileges;
The steps for assigning such privileges to a user are discussed in the Pre-requisites for monitoring the Citrix Delivery Controller 7.x. Specify the name of such a user, here. |
|
Password |
Specify the password for the user specified in the Username text box, here. |
|
Confirm Password |
Confirm the Password by retyping it here. |
|
Domain |
Here, specify the domain to which the user specified in the Username text box belongs to. |
|
Show Site Wise Information |
By default, this flag is set to Yes, indicating that the monitored server is the site server of a broker site. For a server which is a site, this test will report metrics at the site-level - accordingly, a set of metrics will be reported for each delivery group managed by every broker in the site. On the other hand, if the monitored broker is only a member of a site and not the site server, then set this flag to No. In this case, the test will not report any metrics. |
|
DD Frequency |
Refers to the frequency with which detailed diagnosis measures are to be generated for this test. The default is 1:1. This indicates that, by default, detailed measures will be generated every time this test runs, and also every time the test detects a problem. You can modify this frequency, if you so desire. Also, if you intend to disable the detailed diagnosis capability for this test, you can do so by specifying none against DD Frequency. |
|
Detailed Diagnosis |
To make diagnosis more efficient and accurate, the eG Enterprise embeds an optional detailed diagnostic capability. With this capability, the eG agents can be configured to run detailed, more elaborate tests as and when specific problems are detected. To enable the detailed diagnosis capability of this test for a particular server, choose the On option. To disable the capability, click on the Off option. The option to selectively enable/disable the detailed diagnosis capability will be available only if the following conditions are fulfilled:
|
| Measurement | Description | Measurement Unit | Interpretation | ||||||||||||
|---|---|---|---|---|---|---|---|---|---|---|---|---|---|---|---|
|
Is application enabled? |
Indicates whether/not this application is enabled on this site. |
|
The values that this measure reports and their corresponding numeric values are:
Note: By default, this measure reports the values Yes or No while indicating whether the application is enabled or not in this site. However, the graph of this measure will represent the same using the corresponding numeric equivalents of 0 and 1 only. The detailed diagnosis of this measure if enabled, lists the name and type of the application, the location of the program file and the working directory. |
||||||||||||
|
Is application visible to users? |
Indicates whether/not this application is visible to the users of this site. |
|
The values that this measure reports and their corresponding numeric values are:
Note: By default, this measure reports the values Yes or No while indicating whether the application is visible or not in this site. However, the graph of this measure will represent the same using the corresponding numeric equivalents of 0 and 1 only. |
||||||||||||
|
Instances currently running |
Indicates the number of instances of this application that are currently running in this site. |
Number |
Comparing the value of this measure across all the applications will help you to identify the application that is most often used by the users. The detailed diagnosis of this measure if enabled, lists the name of the application, the application type, the name of the catalog and delivery group to which the machine belongs, the zone to which the delivery group belongs, the machine ID, the user accessing the application, the client name and IP address, the protocol used for establishing the session, the start time of the session, the number of sessions – if the session is a Single session or a Multiple session etc. |
||||||||||||
|
CPU priority level |
Indicates the priority level that is set for the resource usage of this application. |
|
The values that this measure can report and their corresponding numeric values are:
Note: By default, this measure reports the above mentioned values while indicating the priority level with which the application has to be processed. However, the graph of this measure will represent the same using the corresponding numeric equivalents only. |
The detailed diagnosis of the Is application enabled? measure lists the name and type of the application, the location of the program file and the working directory.
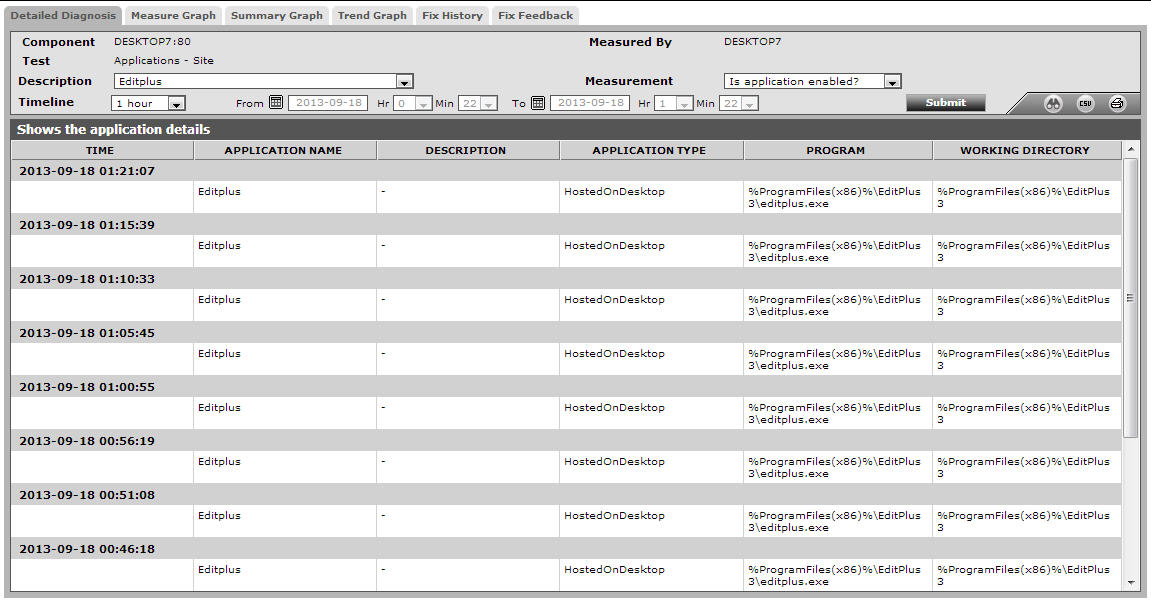
Figure 1 : The detailed diagnosis of the Is application enabled? measure
The detailed diagnosis of the Instances currently running measure lists the name of the application, the name of the application, the application type, the name of the catalog and delivery group to which the machine belongs to, the machine ID, the user accessing the application, the client name and IP address, the protocol used for establishing the session, the start time of the session, the number of sessions – if the session is a Single session or a Multiple session etc.
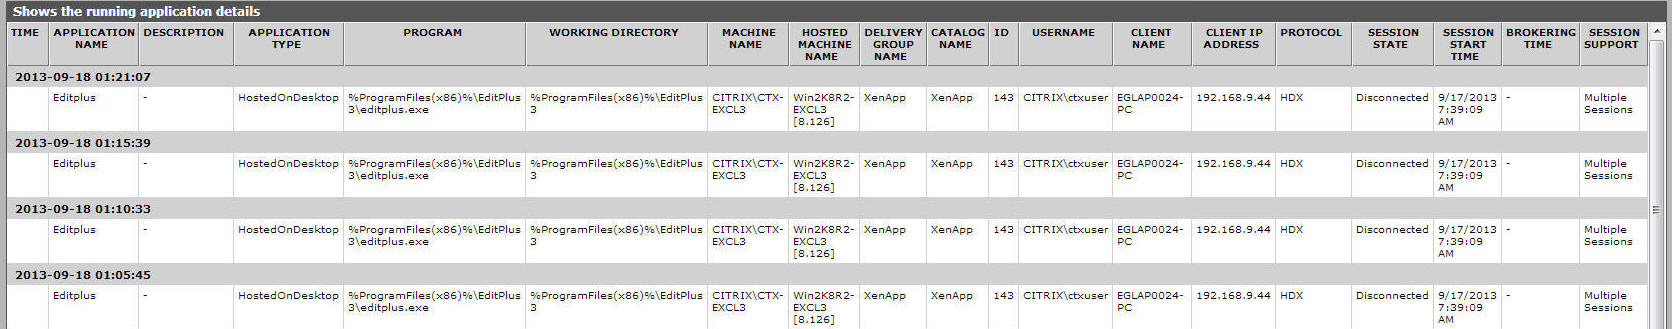
Figure 2 : The detailed diagnosis of the Instances currently running measure