Session and Application States Test
In the event of a session overload on XenDesktop, administrators may want to know the type of sessions that may have contributed to the overload – HDX sessions? or RDP sessions? This can be determined using the Session and Application States test. For every type of session (HDX and RDP) on the broker, this test reports the total session count and the status of the sessions.
Target of the test : A Citrix Delivery Controller 7.x
Agent deploying the test : An internal agent
Outputs of the test : One set of results for each session type; an All descriptor also appears, which reports aggregated metrics across all session types.
| Parameter | Description |
|---|---|
|
Test Period |
How often should the test be executed. |
|
Host |
The IP address of the host for which this test is to be configured. |
|
Port |
Refers to the port at which the specified host listens to. |
|
Username |
In order to monitor the target Delivery Controller 7, eG requires a special user with the following privileges;
The steps for assigning such privileges to a user are discussed in the Pre-requisites for monitoring the Citrix Delivery Controller 7.x. Specify the name of such a user, here. |
|
Password |
Specify the password for the user specified in the Username text box, here. |
|
Confirm Password |
Confirm the Password by retyping it here. |
|
Domain |
Here, specify the domain to which the user specified in the Username text box belongs to. |
|
Report by Machine Type |
By default, this flag is set to Yes indicating that the individual descriptors of this test - i.e., the delivery groups- are classified based on their machine type; in other words, the delivery groups will be listed either under Server OS Machines or Desktop OS Machines based on their machine type. If you do not want to group the delivery groups based on their machine types, set this flag to No. |
|
DD Frequency |
Refers to the frequency with which detailed diagnosis measures are to be generated for this test. The default is 1:1. This indicates that, by default, detailed measures will be generated every time this test runs, and also every time the test detects a problem. You can modify this frequency, if you so desire. Also, if you intend to disable the detailed diagnosis capability for this test, you can do so by specifying none against DD frequency. |
|
Detailed Diagnosis |
To make diagnosis more efficient and accurate, the eG Enterprise embeds an optional detailed diagnostic capability. With this capability, the eG agents can be configured to run detailed, more elaborate tests as and when specific problems are detected. To enable the detailed diagnosis capability of this test for a particular server, choose the On option. To disable the capability, click on the Off option. The option to selectively enable/disable the detailed diagnosis capability will be available only if the following conditions are fulfilled:
|
| Measurement | Description | Measurement Unit | Interpretation |
|---|---|---|---|
|
Total sessions |
Indicates the total number of user sessions. |
Number |
This is a good indicator of the session load on the broker. If a consistent increase is observed in the value of this measure for the All descriptor, it could hint at a potential overload condition. In such situations, you can compare the value of this measure across session types to figure out which type of session is high on the broker – HDX or RDP? |
|
Active sessions |
Indicates the number of user sessions of this type that are currently active on the broker. |
Number |
A consistent zero value could indicate a connection issue. To determine the details of the currently active sessions, use the detailed diagnosis of this measure. |
|
Connected sessions: |
Indicates the number of sessions of this type that are currently connected. |
Number |
The detailed diagnosis of this measure if enabled, lists the Session ID, the name of the machine, the name of the catalog and delivery group to which the machine belongs, the zone to which the catalog belongs, the server on which the machine is hosted, the hypervisor name, the user who is active on the session, the protocol used for connecting to the session, the Client IP and version, the state of the session, the time for which the session is connected, the time at which the state of the session changed, the start time of the session, the brokering time, the number of session supported – whether single session or multiple session, the applications that are currently in use if the machine in operation is a XenApp etc. |
|
Disconnected sessions |
Indicates the number of sessions of this type that are currently disconnected. |
Number |
If all the current sessions suddenly log out, it indicates a problem condition that requires investigation. The detailed diagnosis of this measure lists the sessions that were logged out. |
|
Reconnecting sessions |
Indicates the number of sessions of this type that are reconnecting soon after a disconnect. |
Number |
The detailed diagnosis of this measure lists the sessions that reconnected soon after a disconnect. |
|
Preparing sessions |
Indicates the number of sessions of this type that are currently in the Preparing state. |
Number |
The detailed diagnosis of this measure lists the sessions that are currently in the Preparing state. |
|
Non-brokered sessions |
Indicates the number of user sessions of this type that were not brokered by the machines managed by this broker. |
Number |
The detailed diagnosis of this measure lists the sessions that were not brokered by the machines managed by this broker. |
|
Unknown sessions |
Indicates the number of sessions of this type that are currently in Unknown state. |
Number |
The detailed diagnosis of this measure lists the sessions that are currently in Unknown state. |
|
Other sessions |
Indicates the number of sessions of this type that are currently in Other state. |
Number |
The detailed diagnosis of this measure lists the sessions that reconnected soon after a disconnect. |
|
Hidden sessions |
Indicates the number of sessions of this type that are currently hidden. |
Number |
The detailed diagnosis of this measure lists the sessions that are currently hidden. |
|
Autonomously brokered sessions |
Indicates the number of sessions of this type that are brokered without the use of this broker. |
Number |
The detailed diagnosis of this measure lists the sessions that are autonomously brokered. |
|
Pre-logon |
Indicates the number of applications that are in pre-logon state for the sessions of this type. |
Number |
This measure is only applicable for Server OS Machines descriptor. Use the detailed diagnosis of this measure to know which applications are in the pre-logon state.
|
|
Pre-launched |
Indicates the number of applications for which sessions of this type are prelaunched. |
Number |
This measure is only applicable for Server OS Machines descriptor. The session prelaunch enables all or specified users access applications quickly, by starting sessions before they are requested. The session will wait for a user, and when the user starts an application prelaunched session is replaced with a regular session. Use the detailed diagnosis of this measure to know which applications are in the pre-launched state. |
|
Active applications |
Indicates the number of applications that are currently running in the sessions of this type. |
Number |
This measure is only applicable for Server OS Machines descriptor. Use the detailed diagnosis of this measure to know which are the active applications. |
|
Lingering |
Indicates the number of sessions of this type that are in active state even after the applications are closed. |
Number |
This measure is only applicable for Server OS Machines descriptor. Use the detailed diagnosis of this measure to know which sessions are active even after the applications are closed. |
|
No applications |
Indicates the number of sessions of this type that are active without any application launch. |
Number |
This measure is only applicable for Server OS Machines descriptor. Use the detailed diagnosis of this measure to know which sessions are active without any application launch. |
Use the detailed diagnosis of the Active sessions measure to know which sessions are presently active.
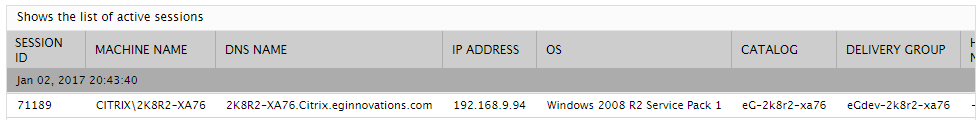
Figure 1 : The detailed diagnosis of the Active sessions measure
To know which sessions are currently disconnected, use the detailed diagnosis of the Disconnected sessions measure.
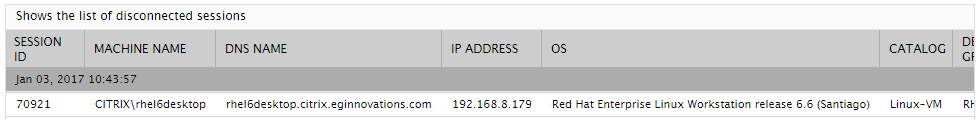
Figure 2 : The detailed diagnosis of the Disconnected sessions measure
The detailed diagnosis of the Active applications measure reveals the complete details of applications that are currently running.
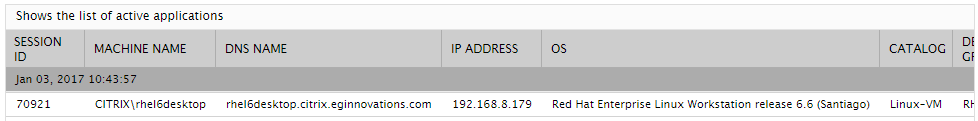
Figure 3 : The detailed diagnosis of the Active applications measure