PVS Sites Test
A site provides both a “Site Administrator” and farm administrator, with a method of representing and managing logical groupings of Provisioning Servers, Device Collections, and local shared storage.
Provisioning Servers within a site, communicate with farm components to obtain the information necessary to boot target devices and to provide target devices with the appropriate vDisk.
This test auto-discovers the sites configured within a Provisioning server farm, and reports the number and status of servers, target devices, and vDisks managed by the site.
Target of the test : Citrix Provisioning server
Agent deploying the test : An internal agent
Outputs of the test : By default, the test reports one set of results for every site configured in the Citrix Provisional server farm being monitored
| Parameters | Description |
|---|---|
|
Test Period |
How often should the test be executed. |
|
Host |
The nick name for the target component for which this test is to be configured. |
|
Port |
Refers to the port at which the specified host listens to. By default, this is NULL. |
|
MCLI Path |
This test executes commands using the Management Command Line Interface (MCLI) of the Provisioning server to collect the required metrics. To enable the test to execute the commands, the eG agent, by default, auto-discovers the full path MCLI.exe on the target Provisioning server. This is why, the mcli path is set to none by default. If, for some reason, the eG agent is unable to auto-discover the MCLI path, then you will have to manually specify the path here using the following pointers:
|
|
Domain Name, Domain User and Domain Password |
To report farm-related metrics, this test should run using the credentials of a user who fulfills the following requirements:
The steps for assigning such privileges to a user are detailed in the Pre-requisites for monitoring the Citrix Provisioning Server Once you assigned the aforesaid privileges to the user, then configure this test with the domain name, Domain User, and Domain Password of the same user. |
|
Local Host Only |
By default, this flag is set to Yes. This implies that, by default, the test reports metrics for the target server that is being monitored. Setting the flag to No ensures that the test auto-discovers all the servers that are part of the PVS farm, and reports metrics for each server in the PVS farm. |
|
Enabled Device DD |
By default, this flag is set to No. This means that, by default, this test will not report detailed diagnostics for the Enabled devices measure - i.e., you will not be able to view the list of enabled devices. To enable the ability of the test to collect and report the list of enabled devices, set this flag to Yes. |
|
Disabled Device DD |
By default, this flag is set to No. This means that, by default, this test will not report detailed diagnostics for the Disabled devices measure - i.e., you will not be able to view the list of disabled devices. To enable the ability of the test to collect and report the list of disable devices, set this flag to Yes. |
|
Show vDisk Version |
By default, this flag is set to No indicating that this test will not display the vDisk version in the detailed diagnosis reported by the Active vDisks and Inactive vDisks measures. However, you can set this flag to Yes if you want this test to display the vDisk version as a part of the detailed diagnosis of the mentioned measures. |
|
Detailed Diagnosis |
To make diagnosis more efficient and accurate, the eG Enterprise embeds an optional detailed diagnostic capability. With this capability, the eG agents can be configured to run detailed, more elaborate tests as and when specific problems are detected. To enable the detailed diagnosis capability of this test for a particular server, choose the On option. To disable the capability, click on the Off option. The option to selectively enable/disable the detailed diagnosis capability will be available only if the following conditions are fulfilled:
|
| Measurement | Description | Measurement Unit | Interpretation |
|---|---|---|---|
|
Total servers |
Indicates the total number of Provisioning servers managed by this site. |
Number |
|
|
Active servers |
Indicates the number of Provisioning servers that are currently active in this site. |
Number |
Use the detailed diagnosis of this measure to know which servers in the site are active. |
|
Inactive servers |
Indicates the number of inactive servers in this site. |
Number |
Use the detailed diagnosis of this measure to know which servers in the site are inactive. |
|
Total devices |
Indicates the total number of target devices managed by this site. |
Number |
A target device is a device, such as a desktop computer or server, in a Provisioning services farm, that boots and gets software from a vDisk on the network. |
|
Enabled devices |
Indicates the number of target devices in this site that are connected to vDisks. |
Number |
You can instantly identify the active target devices in a site with the help of the detailed diagnosis of this measure. |
|
Disabled devices |
Indicates the number of target devices in this site that are not connected to vDisks. |
Number |
Use the detailed diagnosis of this measure to know which target devices in the site are inactive. |
|
Total vDisks |
Indicates the total number of vDisks managed by this disk. |
Number |
vDisks exist as disk image files on a Provisioning Server or on a shared storage device. |
|
Active vDisks |
Indicates the number of vDisks in this site that are used by target devices. |
Number |
Use the detailed diagnosis of this measure to know which vDisks are being actively used by target devices. |
|
Inactive vDisks |
Indicates the number of vDisks in this site that are not used by target devices. |
Number |
Use the detailed diagnosis of this measure to know which vDisks are inactive in the site. |
Use the detailed diagnosis of the Active servers measure to know the IP address and name of the active servers in the site.
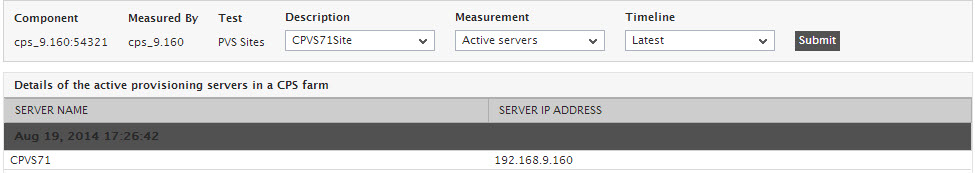
Figure 1 : The detailed diagnosis of the Active servers measure
Use the detailed diagnosis of the Active vDisks measure to know which vDisks are being actively used by target devices.
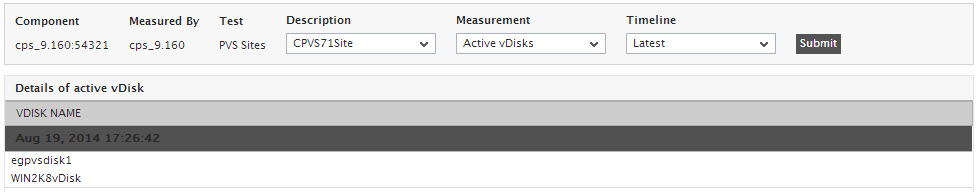
Figure 2 : The detailed diagnosis of the Active vDisks measure