User Logon Performance Test
The Logon Performance test monitors the user logon process from a delivery group perspective; in other words, it monitors user logins to the desktops/applications in a delivery group, measures the ‘aggregate’ duration of the login across all users to that group, and thus points to bottlenecks in the user logon process to that group.
The User Logon Performance test on the other hand, provides the user-perspective to logon monitoring. In other words, this test tracks each user who logs into a desktop or accesses an application via the controller, reports in real-time the logon experience of that user, and pinpoints where exactly that user’s logon slowed down. When a user complaints of delays in accessing his/her virtual desktop, this test will lead administrators straight to what is causing the delay. Detailed diagnositics provided by this test reveal which machines/applications a user is accessing and which delivery group these machines/applications belong to.
Note:
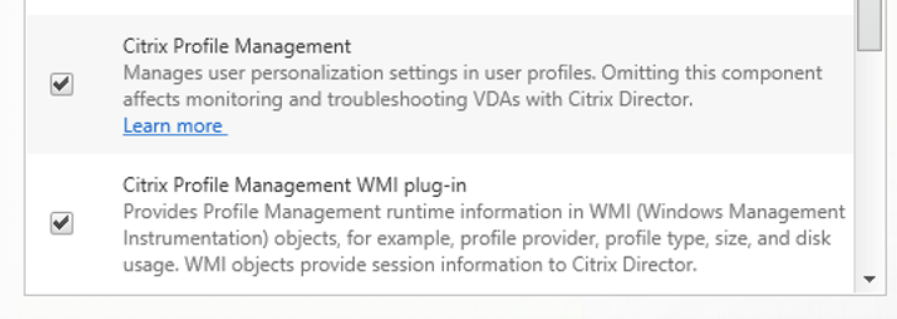
This test will report metrics only if the Citrix Profile Management and Citrix Profile Management WMI Plugin features are enabled while installing the Citrix VDA as shown in the following illustration.
Target of the test : A controller in a Citrix Virtual Apps/Desktops Site 7.x
Agent deploying the test : An internal agent
Outputs of the test : One set of results for each user to the controller in the site.
| Parameter | Description |
|---|---|
|
Test Period |
How often should the test be executed |
|
Host |
The IP address of the host for which the test is being configured. |
|
Port |
The port number at which the specified Host listens to. By default, this is 80. |
|
Controller IP Address |
To monitor a site and pull metrics on its performance, the eG agent communicates with a delivery controller in that site. If the target site contains only one controller, then, you need to configure the Controller IP Address parameter with the IP address of that controller, so that the eG agent can use that controller for monitoring the site. Note that in this case, if the controller stops functioning for any reason, the eG agent will not be able to monitor the site any longer. Some sites may be configured with multiple delivery controllers to ensure high-availability, and to optimize and load-balance user connections. When monitoring such a site, you have the option of configuring the Controller IP Address parameter with a comma-separated list of controllers. For instance, the list should be in the following format: 192.160.1.10,198.160.1.11,198.160.1.12. In this case, the eG agent checks the availability of each configured controller at run time, picks the controller that is up and running at that time, and communicates with that controller for collecting metrics on site performance. This way, you can ensure that the non-availability of a single controller, does not impact site monitoring. |
|
Controller Port |
Specify the port number of the delivery controller in the site with which the eG agent should communicate for collecting performance metrics. |
|
Username |
To connect to a delivery controller and pull out metrics from it, the eG agent requires Farm Administrator rights. In order to configure the eG agent with Farm Administrator privileges, specify the credentials of the Farm Administrator in the Username and Password text boxes. This user should also be assigned the Allow log on locally privilege on the Citrix Virtual Apps/Desktops Site 7.x host. The steps for assigning the Allow log on locally privilege are explained in the Pre-requisites for monitoring the Citrix Virtual Apps/Desktops Site 7.x |
|
Confirm Password |
Confirm the Password by retyping it here. |
|
Fully Qualified Domain Name |
Here, specify the fully-qualified name of the domain to which the specified controller belongs. |
|
SSL |
Indicate whether/not the controller used for metrics collection is SSL-enabled. By default, this flag is set to Yes. |
|
Report Summary |
By default, this flag is set to Yes indicating that this test will report metrics for the Summary descriptor, by default. However, if you do not want this test report the metrics for the Summary descriptor, then st this flag to No. |
|
DD Frequency |
Refers to the frequency with which detailed diagnosis measures are to be generated for this test. The default is 1:1. This indicates that, by default, detailed measures will be generated every time this test runs, and also every time the test detects a problem. You can modify this frequency, if you so desire. Also, if you intend to disable the detailed diagnosis capability for this test, you can do so by specifying none against DD Frequency. |
|
Detailed Diagnosis |
To make diagnosis more efficient and accurate, the eG Enterprise embeds an optional detailed diagnostic capability. With this capability, the eG agents can be configured to run detailed, more elaborate tests as and when specific problems are detected. To enable the detailed diagnosis capability of this test for a particular server, choose the On option. To disable the capability, click on the Off option. The option to selectively enable/disable the detailed diagnosis capability will be available only if the following conditions are fulfilled:
|
| Measurement | Description | Measurement Unit | Interpretation |
|---|---|---|---|
|
Average logon duration |
Indicates the average time taken for this user to login to desktops/access applications. |
Secs |
If this measure reports a high value consistently, it could indicate a slowdown in the logon process. Compare the value of this measure across users to know which user’s logon is taking the longest. |
|
Logons |
Indicates the number of times this user has logged in since the last measurement period |
Number |
|
|
Brokering duration |
Indicates time taken by this user to complete the process of brokering sessions. |
Secs |
A high value indicates that brokering is taking a long time. If the Average logon duration is very high, you may want to compare the value of this measure with that of the VM start duration, HDX connection duration, Authentication duration, GPOs duration, Logon scripts duration, Citrix profile load duration, and Interactive session duration measures to know where exactly the user logon process slowed down – is it during authentication? Is it during brokering? Is it when establishing the HDX connection? Is it when applying GPOs? Is it during logon scripts execution? Is it while loading user profiles? Is it when starting the VM? Or is it when handing over control to the user? |
|
VM start duration |
Indicates the time taken by the controller to start the machines accessed by this user. |
Secs |
A high value indicates that machines are taking too long to startup. If the Average logon duration is very high, you may want to compare the value of this measure with that of the Brokering duration, HDX connection duration, Authentication duration, GPOs duration, Logon scripts duration, Citrix profile load duration, and Interactive session duration measures to know where exactly the user logon process slowed down – is it during authentication? Is it during brokering? Is it when establishing the HDX connection? Is it when applying GPOs? Is it during logon scripts execution? Is it while loading user profiles? Is it when starting the VM? Or is it when handing over control to the user? |
|
HDX connection duration |
Indicates the time taken by the controller to complete the steps required for setting up the HDX connection from this user to the machines accessed by the user. |
Secs |
A high value indicates that HDX connections are taking time to be established. If the Average logon duration is very high, you may want to compare the value of this measure with that of the Brokering duration, VM start durtion, Authentication time, GPOs duration, Logon scripts duration, Citrix profile load time, and Interactive session duration measures to know where exactly the user logon process slowed down – is it during authentication? Is it during brokering? Is it when establishing the HDX connection? Is it when applying GPOs? Is it during logon scripts execution? Is it while loading user profiles? Is it when starting the VM? Or is it when handing over control to the user? |
|
Authentication duration |
Indicates the time taken by the controller to authenticate this user’s sessions. |
Secs |
A high value indicates authentication delays. If the Average logon duration is very high, you may want to compare the value of this measure with that of the Brokering duration, Time taken for starting VM, HDX connection duration, GPOs duration, Logon scripts duration, Profile load time, and Interactive session duration measures to know where exactly the user logon process slowed down – is it during authentication? Is it during brokering? Is it when establishing the HDX connection? Is it when applying GPOs? Is it during logon scripts execution? Is it while loading user profiles? Is it when starting the VM? Or is it when handing over control to the user? |
|
GPOs duration |
Indicates the time taken to apply group policy settings on the machines accessed by this user. |
Secs |
A high value indicates that GPO application is taking time. If the Average logon duration is very high, you may want to compare the value of this measure with that of the Brokering duration, Time taken for starting VM, HDX connection duration, Authentication time, Logon scripts duration, Profile load time, and Interactive session duration measures to know where exactly the user logon process slowed down – is it during authentication? Is it during brokering? Is it when establishing the HDX connection? Is it when applying GPOs? Is it during logon scripts execution? Is it while loading user profiles? Is it when starting the VM? Or is it when handing over control to the user? |
|
Logon scripts duration |
Indicates the time taken for logon scripts to be executed on the machines accessed by this user. |
Secs |
A high value indicates that logon script execution is taking time. If the Average logon duration is very high, you may want to compare the value of this measure with that of the Brokering duration, VM start duration, HDX connection duration, Authentication duration, GPOs duration, Citrix profile load duration, and Interactive session duration measures to know where exactly the user logon process slowed down – is it during authentication? Is it during brokering? Is it when establishing the HDX connection? Is it when applying GPOs? Is it during logon scripts execution? Is it while loading user profiles? Is it when starting the VM? Or is it when handing over control to the user? |
|
Citrix profile load duration |
Indicates the time taken by the logon process to load the profile of this user. |
Secs |
A high value indicates that profiles are taking too long to load. If the Average logon duration is very high, you may want to compare the value of this measure with that of the Brokering duration, VM start duration, HDX connection duration, Authentication duration, GPOs duration, Logon scripts duration, and Interactive session duration measures to know where exactly the user logon process slowed down – is it during authentication? Is it during brokering? Is it when establishing the HDX connection? Is it when applying GPOs? Is it during logon scripts execution? Is it while loading user profiles? Is it when starting the VM? Or is it when handing over control to the user? |
|
Interactive session duration |
Indicates the time taken by the logon process to handoff keyboard and mouse control to this user. |
Secs |
A high value indicates delays in handing off keyboard and mouse control to users. If the Average logon duration is very high, you may want to compare the value of this measure with that of the Brokering duration, VM start duration, HDX connection duration, Authentication duration, GPOs duration, Logon scripts duration, and Citrix profile load duration measures to know where exactly the user logon process slowed down – is it during authentication? Is it during brokering? Is it when establishing the HDX connection? Is it when applying GPOs? Is it during logon scripts execution? Is it while loading user profiles? Is it when starting the VM? Or is it when handing over control to the user? |
|
Pre-user initialization duration |
Indicates the time overlaps with Group Policy Objects and logon scripts (configured through GPO). |
Seconds |
If the value of this measure is high, administrators should consider optimizing the Group Policy Objects and logon scripts configured through GPO. |
|
User initialization duration |
Indicates the time taken for executing userinit.exe for this user. |
Seconds |
When a user logs on to a Windows machine, Winlogon runs userinit.exe which runs logon scripts, re-establishes network connections, and then starts Explorer.exe, and the Windows user interface. If Average logon duration is abnormally high, then compare the value of this measure with the other time measurements to determine whether/not the logon delay can be attributed to slowness in the completion of user initialization tasks. A high value of this measure could indicate that the machine is not able to reach domain controller a network issue or a large number of logon scripts (corrupt) are configured through active directory user object. To resolve the issue, the administrators should immediately initiate the investigation before it causes serious impact on the logon process. |
|
Shell duration |
Indicates the duration between the initialization of the user interface to the time the user receives keyboard and mouse control. |
Seconds |
A high value of this measure could indicate that the VDA is heavily loaded with numerous applications running or if desktop has too many icons, etc. |
|
Delay duration |
Indicates the cumulative time delay between the Pre-userinit and Userinit phases. |
Seconds |
|
|
Other processing duration |
Indicates the time taken by this user to perform processes other than logon related processes. |
Seconds |
The value of this measure is calculated as follows:
|