How to Monitor Dell PowerEdge VRTX Using the eG Enterprise Monitor?
eG Enterprise monitors the Dell PowerEdge VRTX using a single eG external agent that is deployed on any remote host in the environment. The external agent executes various tests that connect to the SNMP MIB of the Dell PowerEdge VRTX to be monitored and collects the metrics related its performance. To enable the eG agent to pullout metrics, ensure that the Dell PowerEdge VRTX is SNMP-enabled.
Managing the Dell PowerEdge VRTX
The eG Enterprise cannot automatically discover the Dell PowerEdge VRTX. This implies that you need to manually add the component for monitoring. Remember that a Dell PowerEdge VRTX component added manually will be managed automatically the eG Enterprise. To manage a Dell PowerEdge VRTX component, do the following:
- Log into the eG administrative interface.
- Follow the Components -> Add/Modify menu sequence in the Infrastructure tile of the Admin menu.
-
In the COMPONENT page that appears next, select Dell PowerEdge VRTX as the Component type. Then, click the Add New Component button. This will invoke Figure 1.1.
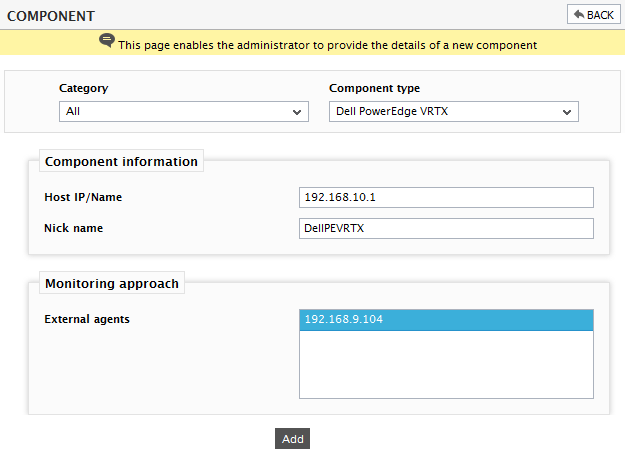
- Specify the Host IP/Name and the Nick name of the Dell PowerEdge VRTX as shown in Figure 1. Then, click the Add button to register the changes.
-
When you attempt to sign out, a list of unconfigured tests will appear as shown in Figure 2.
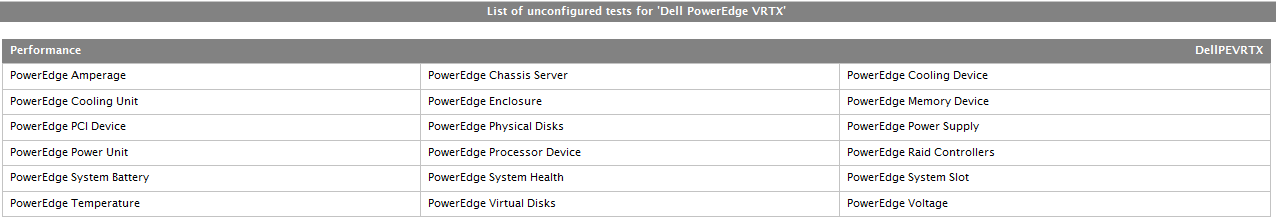
Figure 2 : List of unconfigured tests to be configured for the Dell PowerEdge VRTX
-
Click on any test in the list of unconfigured tests. For instance, click on the PowerEdge Amperage test to configure it. In the page that appears, specify the parameters as shown in Figure 3.
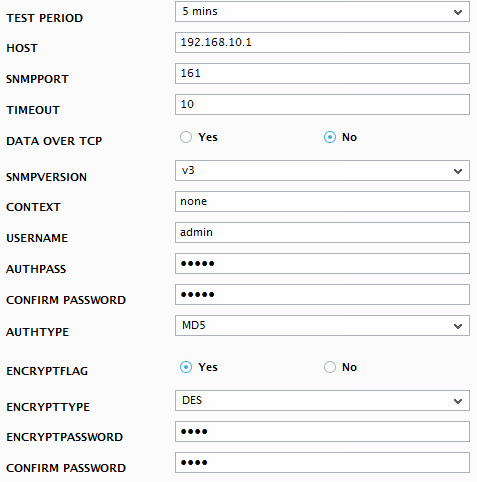
- To know how to configure these parameters, refer to Monitoring Dell PowerEdge VRTX chapter.
- Finally, signout of the eG administrative interface.