How to Monitor Egenera PAN Manager Using eG Enterprise?
eG Enterprise monitors Egenera PAN Manager using an agentless mechanism. The eG data collector executes the PAN Manager Web Server API commands on the PAN manager and collects a wide variety of performance statistics from the PAN manager.
Managing the Egenera PAN Manager
The eG Enterprise cannot automatically discover the Egenera PAN Manager so that you need to manually add the component for monitoring. Remember that the eG Enterprise automatically manages the components that are added manually. To manage a Egenera PAN Manager component, do the following:
- Log into the eG administrative interface.
- Follow the Components -> Add/Modify menu sequence in the Infrastructure tile of the Admin menu.
-
In the COMPONENT page that appears next, select Egenera PAN Manager as the Component type. Then, click the Add New Component button. This will invoke Figure 1.
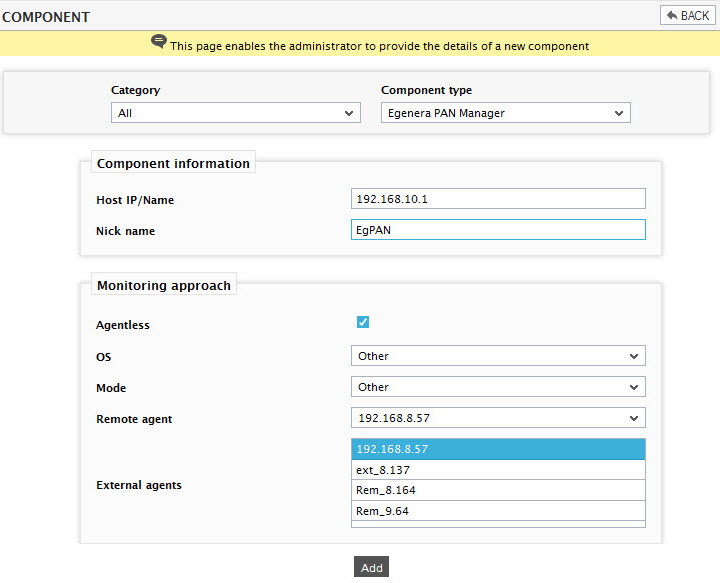
- Specify the Host IP/Name and the Nick name of the Egenera PAN Manager in Figure 1. Since the Egenera PAN Manager is monitored in an agentless manner, select Other as the OS and Other as the Mode.
- Then, click the Add button to register the changes.
-
When you attempt to sign out, a list of unconfigured tests will appear as shown in Figure 2.
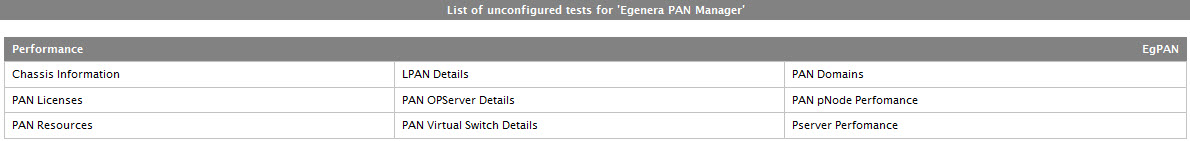
Figure 2 : List of unconfigured tests to be configured for the Egenera PAN Manager
-
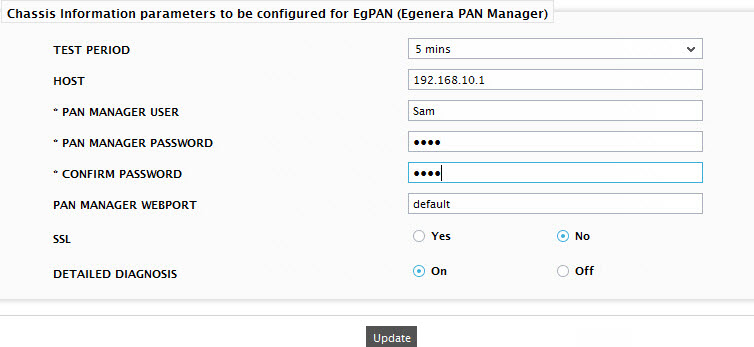
Click on any test in the list of unconfigured tests. For instance, click on the Chassis Information test to configure it. In the page that appears, specify the parameters as shown in Figure 3.
- To know how to configure the parameters, refer to Monitoring the Egenera PAN Manager.
- Finally, signout of the administrative interface.