Adding a New Jmx Test
To add a new JMX test, first select the Test option from the Integration Console tile. Click the Add New Test button in the integration console – test page that appears next.
Figure 1 will then appear.
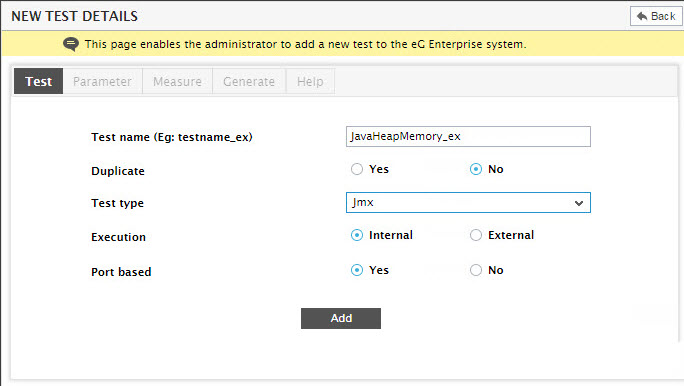
Figure 1 : Adding a new JMX test
In Figure 1, provide the Test name, set Duplicate to No as the new test is not a duplicate of any existing IC test, indicate the Execution mode, and also mention whether the test is a Port based test or not. Finally, select Jmx from the Test type list and click the Add button to add the test.
Note:
Using the Integration Console plugin, you can add an internal or an external test, but you cannot add tests that need to be run by a remote agent – i.e., tests that need to be executed in an agentless manner.
This will automatically lead you to the Parameter tab page (see Figure 2).
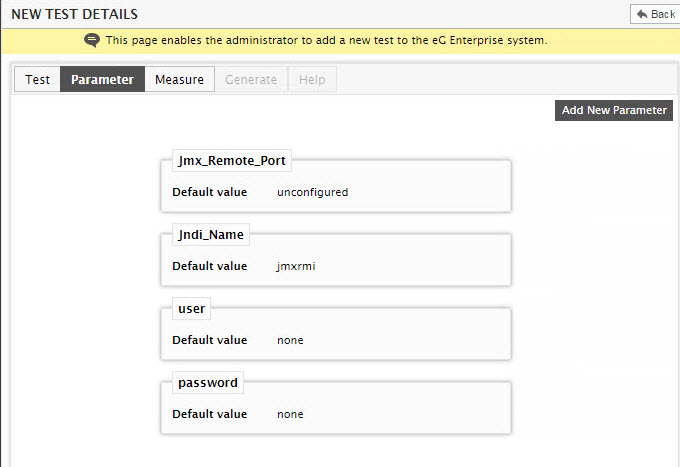
Figure 2 : Viewing the default parameters of the Jmx test
By default, any new test of type Jmx will take the following parameters:
- Jmx_Remote_Port: By default, this parameter is set to unconfigured. This implies that while configuring the JavaHeapMemory_ex test for the javaapp application in our example, you should manually configure this parameter with the port number at which jmx listens for requests from remote hosts. During test configuration, ensure that you specify the same port that you configured in the management.properties file; by default, this file will be in the <JAVA_HOME>\jre\lib\management folder used by the target application (see Enabling JMX Support for the JRE of the Target Application ).
- Jndi_Name: The jndiname is a lookup name for connecting to the JMX connector. By default, this is set to jmxrmi. If you have registered the JMX connector in the RMI registery using a different lookup name, then, while managing the javaapp application and configuring its tests, change this default value to reflect the change in the lookup name.
- user and password: By default, both these parameters are set to none. However, if JMX requires authentication only (but no security), then, at the time of configuring this test for the Javaapp application (in our example), ensure that the user and password parameters are configured with the credentials of a user with read-write access to JMX. To know how to create this user, refer to Configuring the eG Agent to Support JMX Authentication.
- Dynamic_Info_Test: By default, this parameter is set to true indicating that the newly created test will be removed from the layer model if the test does not report metrics for 2 or more consecutive measurement periods. However, if you wish to view the test in the layer model irrespective of the test being in Unknown state, you can Modify this parameter and set the Default value as false.
Since no additional parameters need to be added for the JavaHeapMemory_ex test in our example, simply click on the Measure tab page in Figure 2 to add a new measure. Figure 3 will then appear.
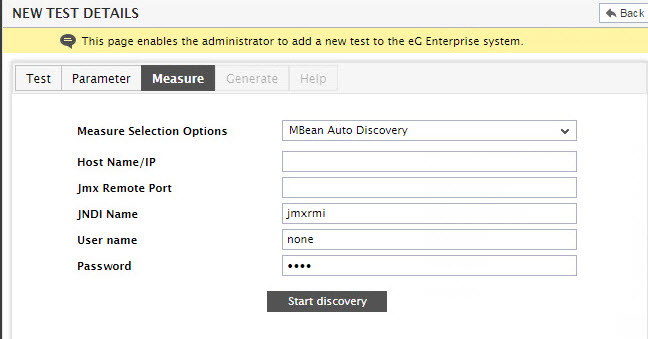
Figure 3 : Adding a new measure for the new Jmx test
Figure 3 allows you the flexibility to choose from multiple methods for configuring the measures of the new Jmx test; these methods are as follows:
- MBean Auto Discovery
- Load MBeans from File
- Manual Entry
To help you understand when and how each of these methods should be used, we will be taking the example of the Heap_memory_used measure of this test and will illustrate how this measure can be added using each of the methodologies listed above.
Adding a Measure Using MBean Auto Discovery
The MBean Auto Discovery option enables the eG manager to automatically discover the domains and MBeans supported by a target Java application, so that you can configure any of the Mbean attributes as a measure with minimal manual effort. Select this option if you do not know the exact Mbean attribute name to be configured as a measure for a new JMX test. When this option is chosen, you will have to additionally specify the following in the new test details page as depicted by Figure 4 below:
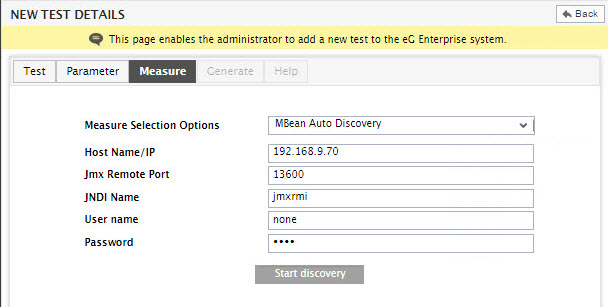
Figure 4 : Configuring the auto-discovery of MBeans
- Host Name / IP: Specify the host name / IP address of the system hosting the javaapp in our example;
- JMX Remote Port: Indicate the port at which the JMX of the javaapp in our example listens;
- JNDI name: Specify the lookup name for connecting to the JMX connector. By default, this is set to jmxrmi.
- User name and Password: By default, both these parameters are set to none. However, if JMX requires authentication only (but no security), then, ensure that these fields are configured with the credentials of a user with read-write access to JMX. To know how to create this user, refer to Configuring the eG Agent to Support JMX Authentication.
Finally, click the Start discovery button.
Doing so will automatically populate the Domain Name drop-down list with the complete list of domains supported by the Java application in our example. From this list, pick the domain that contains the MBeans of interest to us – for our example, pick java.lang as the domain (see Figure 5).
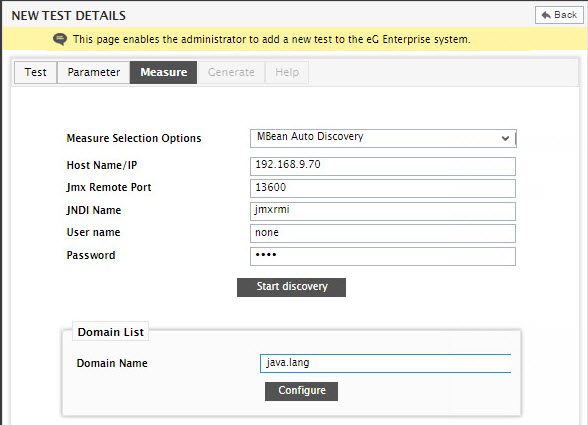
Figure 5 : Selecting a domain for MBean discovery
To proceed with the configuration, click on the Configure button in Figure 5.
Doing so will invoke Figure 6 using which a new measure can be added. Let us begin by adding the Heap_memory_used measure. In order to achieve this, follow the steps given below:
- Specify Heap_memory_used as the Measure name.
- Select Number(20.4) as the Database column size.
- Pick mb as the Unit of the measurement.
-
Pick unaltered as the Process method.
Note:
To know more about the Process method, refer to Adding a Script/Batch File-based Test.
-
Since java.lang has been chosen as the Domain name, the eG manager will automatically discover all the MBeans that are available within java.lang, and will make them available for selection in the Mbean name list. From this list, choose the MBean that reports memory-related statistics for the javaapp application in our example. This would be Memory for our example.
Note:
Once a Domain is chosen for a test, all the measures of that test should be based on the MBeans and attributes within that domain only.
- Upon selection of an Mbean name, all the attributes of the chosen Mbean will be automatically discovered and displayed as the options of the Attribute name list. Now, from the Attribute name list, select the Mbean attribute that reports how much heap memory has been utilized by the javaapp application in our example – for our example, the attribute to be chosen is HeapMemoryUsage>used. Note that, by default, eG Enterprise monitors the chosen ‘Attribute’ across all those MBeans to which it applies.
-
The chosen attribute reports heap memory usage in Bytes. However, the Unit of measurement that we have set for the Heap_memory_used measure is mb. This implies that the eG manager should first convert the number of bytes into MB and then display the final output in the eG monitoring console. To enable bytes to MB conversion, you need to pick a Conversion Factor. The options available by default in the Conversion Factor drop-down list, do not allow ‘Bytes to MB’ conversion. You can however include this capability into the eG Enterprise system by following the steps discussed below:
- Edit the eg_ui.ini file in the <EG_INSTALL_DIR>\manager\config directory.
-
To include a new conversion factor, you will have to append an entry of the following format to the [conversion_factors] section of the file:
DisplayName=Value
-
For instance, to support ‘Bytes to MB’ conversion, append the following entry to the [conversion_factors] section:
/1048576 (Bytes to MB)=0.00000095367431640625
- In this case, the DisplayName, /1048576 (Bytes to MB), will be displayed as an option in the Conversion Factor drop-down list. If this option is chosen, then, at test run time, the conversion value of 0.00000095367431640625 will be multiplied with the actual measure value that is reported in Bytes to convert it into MB. Care should be taken while specifying the conversion value, as incorrect values will result in wrong measures being reported by the test.
- Once the new entry is appended to the [conversion_factors] section, save the file.
- Once this is done, you will find the string /1048576 (Bytes to MB) appear as an option in the Conversion Factor list. For the purpose of our example, pick this as the conversion factor.
- Provide a brief description of the alarm in the Alarm display string text box.
- Finally, click the Add button to add the new measure.
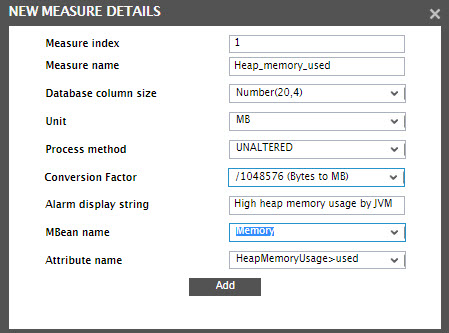
Figure 6 : Adding the Heap_memory_used measure of the Jmx test using the MBean auto-discovery method
Adding a New Measure by Loading MBeans from a File
For Mbean Autodiscovery to work, the eG manager should be able to access the target application. However, in environments where connectivity issues exist between the eG manager and the target Java application say, owing to strict firewall rules, autodiscovery of MBeans may not be possible. In such situations, you can enable the eG agent to load the MBeans of an application onto a file, and then make that file available on the eG manager host, so that the eG manager can download the MBeans from the file. The first step towards this end is to generate the file to which MBeans are to be loaded.
The eG agent is bundled with an AgentMbeanDiscovery.bat file, which is available in the <EG_INSTALL_DIR>\lib directory of the eG agent host. If this batch file is executed, it requests for information that enables access to the target Java application; upon accessing the application, the batch file automatically discovers the MBeans of that application and loads them on to a file.
Like the eG agent, the eG manager is also bundled with a batch file named MgrMbeanDiscovery.bat. This file is available in the <EG_INSTALL_DIR>\lib directory of the eG manager host. The MgrMbeanDiscovery.bat file can be used instead of the AgentMbeanDiscovery.bat, only if all the following conditions prevail:
- The target application should be available on the eG manager host, but the eG manager should not be able to autodiscover the MBeans using the procedure discussed in Adding a Measure Using MBean Auto Discovery
- No agent should be available on the eG manager host;
- No other agent should be able to access the target application.
For instance, you could have a redundant manager setup, where the target Java application executes on a secondary manager host; this host may not have any agent executing on it. Moreover, for security reasons, the firewall could have been configured in such a way that both the primary manager and the eG agents are denied access to the target application.
In such a case, you may first consider auto-discovering the MBeans using the procedure discussed in Adding a Measure Using MBean Auto Discovery. Since this requires access to the eG administrative interface, it cannot be performed from the secondary manager; also, since firewall rules disallow the primary manager-Java application communication, autodiscovery cannot be performed via the primary manager either. Moreover, as no agent has been deployed on the secondary manager host and because the target application is inaccessible to all other agents, the AgentMbeanDiscovery.bat file too cannot be used. In such a case, you can use the MgrMbeanDiscovery.bat file on the secondary manager host to load the Mbeans of the application to a file.
Follow the steps below to load the MBeans of the application to a file using the AgentMbeanDiscovery.bat file:
- Go to the command prompt of the agent host.
- Switch to the <EG_INSTALL_DIR>\lib directory.
- To load the MBeans of the javaapp application on to a file, issue the following command at the prompt: AgentMbeanDiscovery.bat
-
Upon execution, the batch file will request you to specify the following:
Enter the Target Host IP:
Enter the Jmx port:
Enter the JNDIPath:
Enter the Username:
Enter the Password:
Specify the IP address of the target application, the JMX port at which the application listens, the JNDI lookup name of the JMX connector, and the username and password of the JMX.
- Based on the information provided, the batch file auto-discovers the MBeans of the application, generates a file of the format MBeans_IpofApplication_JMXPort.txt in the <EG_AGENT_INSTALL_DIR>\lib directory, and copies the discovered MBeans to the file.
-
Finally, make sure that the file so created is available in the <eg_manager_install_dir>\tmp folder on the eG manager host. To achieve this, you can opt for either of the following:
- You can quickly upload the file to the <EG_MANAGER_INSTALL_DIR>\tmp on the eG manager host from the eG administrative interface;
- You can manually copy the file so created to the <EG_MANAGER_INSTALL_DIR>\tmp directory on the eG manager host
Note:
The MgrMbeanDiscovery.bat file is to be executed the same way as the AgentMbeanDiscovery.bat. However, the difference in the case of the MgrMbeanDiscovery.bat file is, you need to login to the eG manager host to run the batch file, and the command to be executed is: MgrMbeanDiscovery.bat. Also, since the MBean file will be created in the <EG_MANAGER_INSTALL_DIR>\lib directory, you do not have to once again copy/upload the file to the eG manager host.
If you choose option (a) – i.e., if you choose to upload the file via the eG administrative interface – then follow the procedure discussed in Uploading an MBean File to the eG Manager Host and Using that File to Add a New Measure to upload the file and to use it for configuring a measure. On the other hand, if you have manually copied the file to the eG manager host (as suggested by option (b)), then, such a file will pre-exist on the eG manager host at the time of measure configuration. To know how to use an existing MBean file for configuring a measure, refer to Adding a Measure Using an Existing MBean File.
Uploading an MBean File to the eG Manager Host and Using that File to Add a New Measure
For our example, we will be configuring the Heap_memory_used measure using the Mbean attributes loaded from a file. Now, proceed as discussed below:
-
Select the Upload MBean File option in Figure 7 to upload the file to the eG manager host.
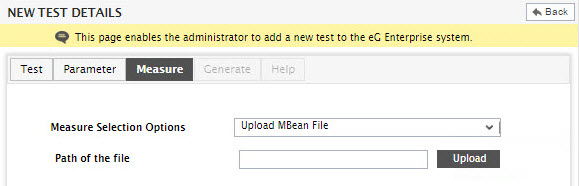
-
Next, specify the full path to the MBeans file that was generated previously in the Path of the file text box. To browse for the file path and upload it, click the Upload button in Figure 7. Figure 8 will then appear.
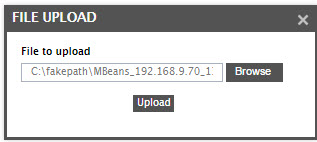
- Click on the Browse button in Figure 8 to browse for the file path, and then click the Upload button therein to upload the file.
-
If the file is successfully uploaded to the eG manager, then the path to which the file has been uploaded will be displayed in the Path of the file text box as depicted by Figure 9.
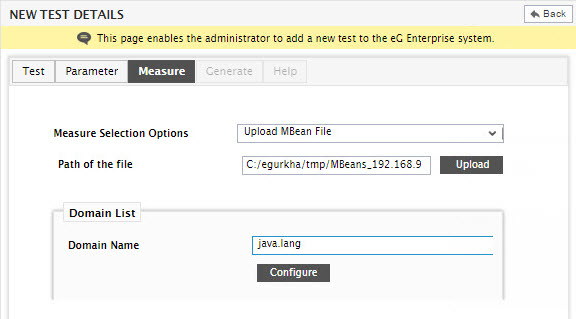
Figure 9 : The path to which the MBean file is uploaded being displayed against Path of the file
-
If a valid MBean file has been uploaded, then the eG Enterprise system will automatically discover the domains from the uploaded file and display the same in the Domain Name list of Figure 9. To proceed with the measure configuration, pick a domain from the list. For our example, pick java.lang as the Domain Name.
Note:
If a test reports multiple measures, then the MBeans and/or attribute names mapped to all such measures should belong to the same Domain.
-
Then, click the Configure button in Figure 9, so that the new measure details window appears (see Figure 10).
Figure 10 : Configuring the Heap_memory_used measure by loading MBeans from a file uploaded to the eG manager
- Configure the Heap_memory_used measure in the same way as discussed in Uploading an MBean File to the eG Manager Host and Using that File to Add a New Measure.
- Finally, click the Add button.
Adding a Measure Using an Existing MBean File
An MBean file may pre-exist in the <EG_MANAGER_INSTALL_DIR>\tmp directory in the eG manager host in the following situations:
- The MBean file may have been manually copied to the eG manager host;
- The MBean file may have already been uploaded to the eG manager using steps 1 to 5 of Uploading an MBean File to the eG Manager Host and Using that File to Add a New Measure.
- The MBean file may have been created using the MgrMbeanDiscovery.bat file (and not the AgentMbeanDiscovery.bat)
To use an existing MBean file to configure a new measure for a jmx test, do the following:
-
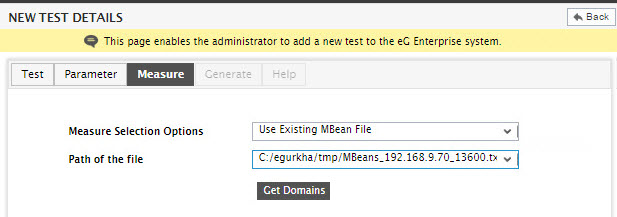
Select the Use Existing MBean File option (see Figure 11). Once this option is chosen, then all the MBean files that pre-exist in the <EG_MANAGER_INSTALL_DIR>\tmp directory in the eG manager host will populate the Path of the file drop-down. From this drop-down, select the file that you want to use for measure configuration.
-
Then, click the Get Domains button to get the domains. The eG Enterprise system will then automatically discover the domains from the chosen file and display the same in the Domain Name list of Figure 12. Pick a domain and click the Configure button to proceed with the measure configuration.
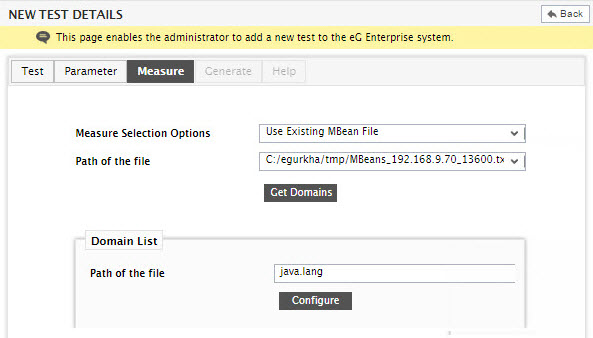
Figure 12 : Selecting a domain from the domains discovered from an existing MBean file
-
When Figure 13 appears, add the Heap_meory_used measure using the steps 1-9 in Adding a Measure Using MBean Auto Discovery.
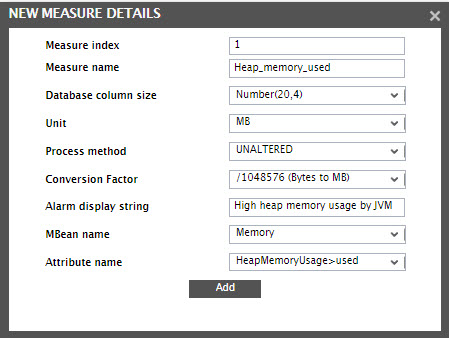
Figure 13 : Adding the Heap_memory_used measure by discovering domains from an existing MBean file
- Finally, click the Add button in Figure 13 to add the measure.
Adding a Measure Using the Manual Entry Method
Use the Manual Entry method if you know the exact domain, Mbean, and attribute that can report the measure you want, and do not wish to needlessly auto-discover MBeans or load them from a file for this purpose.
For the purpose of our example, let us add the Heap_memory_used measure, but this time using the manual entry method. To achieve this, first pick the Manual Entry option from Figure 4. Then, proceed to configure the measure as depicted by Figure 14.
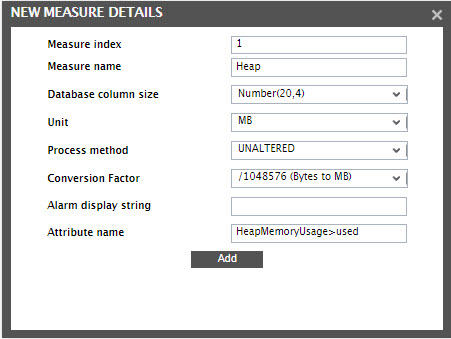
Figure 14 : Configuring the Heap_memory_used measure manually
In Figure 14, specify the following:
- Specify Heap_memory_used as the Measure name.
- Pick Number(20,4) as the Database column size.
- Choose mb as the Unit of measurement.
-
Select unaltered as the Process Method.
Note:
To know more about the Process method, refer to Adding a Script/Batch File-based Test.
-
Specify HeapMemoryUsage>committed as the Attribute name that reports the initial heap memory. Note that, by default, eG Enterprise monitors the chosen ‘Attribute’ across all those MBeans to which it applies.
Note:
If a test reports multiple measures, then the MBean and/or attribute name that is included in each measure specification should belong to the same domain that was chosen for the first measure.
To identify the name of the attribute, do the following:
- Go to the command prompt on the target Java application host;
- Switch to the <JAVA_INSTALL_DIR>\bin directory.
- Issue the jconsole command.
-
Figure 15 will then appear.
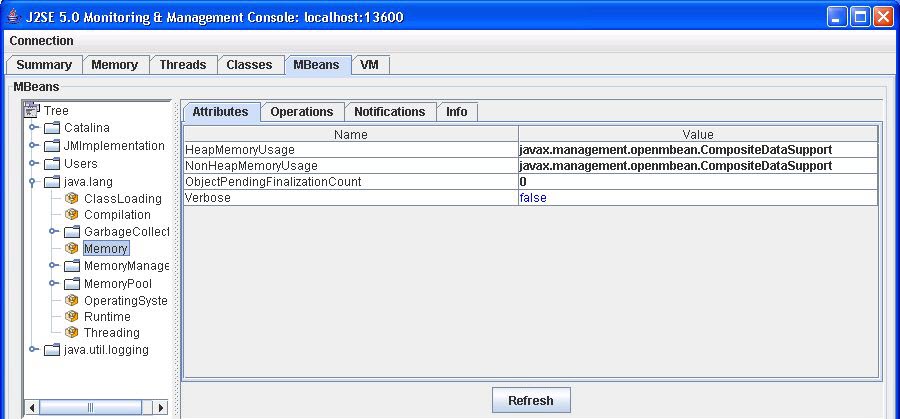
- In the Tree structure in the left panel of Figure 15 locate the java.lang domain to which the Mbean of interest to our example belongs.
- Expand the java.lang domain; since the Heap_memory_used measure in our example is a memory related measure, click on the Memory Mbean within the java.lang domain.
- The right panel of Figure 15 will change to display the Attributes of the Memory Mbean. The top attribute is the HeapMemoryUsage attribute, which reports committed heap memory as its sub-attribute.
- Therefore, to drill down to the heap memory committed attribute, click on the HeapMemoryUsage attribute in the right panel.
-
Figure 16 will then appear.
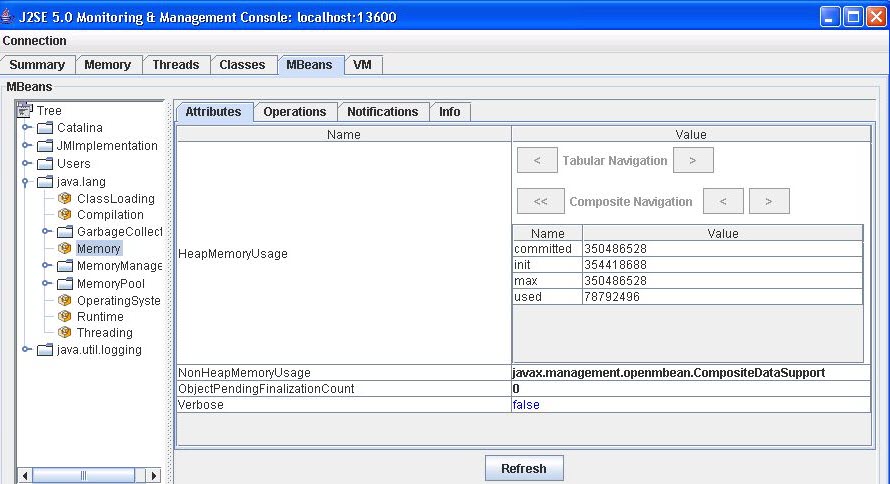
- Figure 16 displays the sub-attributes of the HeapMemoryUsage attribute. One of these sub-attributes is the used attribute.
- Therefore, against the Attribute name field in Figure 14, type both the main attribute – HeapMemoryUsage- and its sub-attribute – used- separated by the ‘>’ symbol.
- Since the specified attribute reports the used heap memory in bytes, you need to select a Conversion Factor to convert the bytes into MB (which is the Unit of measurement of this measure). Therefore, select /1048576 (Bytes to MB) as the Conversion Factor.
- If required, provide an alarm description in the Alarm display string text box.
- Finally, click the Add button in Figure 14.
When prompted to configure additional measures for the test, click No to indicate that no more measures need be added. Doing so will automatically lead you to the Generate tab page (see Figure 17).
If the measures were added using auto-discovered MBeans or the ones loaded from a file, then the Domain that you chose at the time of adding the measures, will be displayed against Domain Name in Figure 17. In the case of our example therefore, java.lang will be displayed as the default Domain Name, if auto-discovered/loaded MBeans were used for configuring the measures.
On the contrary, if the measures were added using the manual entry method, then no Domain Name will be displayed here. In this case, you will have to manually enter the Domain Name. This means that if the Heap_memory_used measure in our example had been configured by manually entering the attribute name, then, you will have to manually specify java.lang as the Domain Name here.
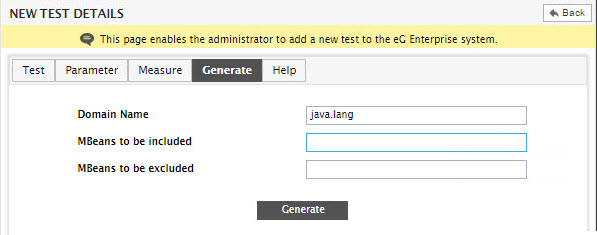
Figure 17 : Generating the Jmx test
Sometimes, the Attribute that reports the value of a measure could be associated with more than one MBean. In such a case, by default, eG Enterprise monitors the Attribute across all the MBeans with which it is mapped. If you want to override this default setting – i.e., if you want the new test to monitor the given Attribute for specific MBeans only and not all of them – then, you can use the MBeans to be included and MBeans to be excluded text boxes for this purpose. To instruct the new test to include a few specific MBeans alone in its monitoring scope, provide a comma-separated list of MBeans in the MBeans to be included text box. Similarly, if you want the test to exclude specific MBeans from monitoring, provide a comma-separated list of these MBeans in the MBeans to be excluded text box. Note that these specifications too are not measure-specific and apply to all the measures configured for a test.
Click on the Generate button in Figure 17 to generate the measures of the test. Figure 18 then appears allowing you to define the thresholds for the measure that we had configured earlier for the JavaHeapMemory_ex test in our example.
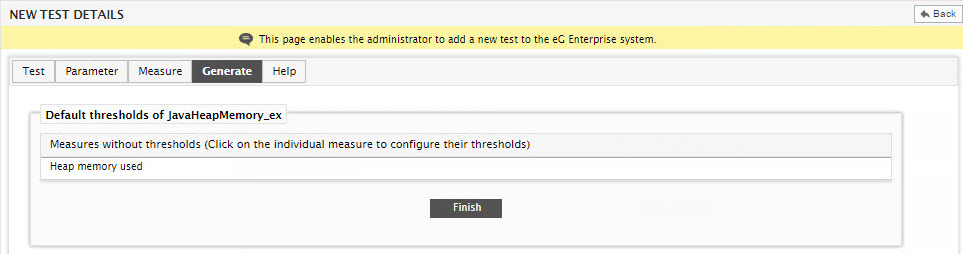
Figure 18 : Defining the thresholds for the measures configured for the JavaHeapMemory_ex test