How to Monitor Web Health Using eG Enterprise?
eG Enterprise monitors health and connectivity of multiple systems that host the websites using an eG external agent that is deployed on any remote host. This eG agent monitors the host systems and gather statistics related to connectivity and availability at configured intervals. Before start monitoring availability of the host systems, add the External Web Health component using the eG admin interface and configure the tests associated with the component. The procedure for achieving this is discussed in the following section.
Adding External Web Health Component
The steps for adding the External Web Health component are detailed below:
- Login to the eG admin interface.
-
Click on the Add Component button in the right corner of the Components at a Glance page that appeared or follow the Infrastructure -> Components -> Add/Modify menu sequence.
- The Components page will then appear. In the Components page, select External Web Health as the Component type and click the Add New Component button.
-
Figure 1 will then appear.
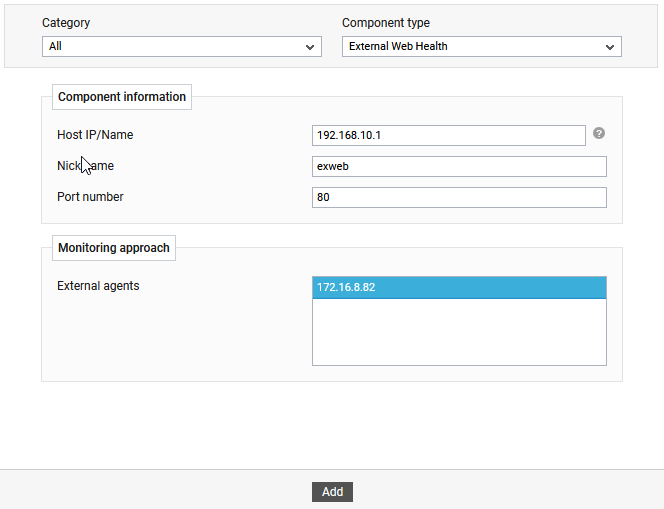
- Specify the Host IP/Name and the Nick name for the External Web Health component in Figure 1. The Host IP/Name of the External Web Health component should be one of the IP addresses of target server hosting web applications/services that you wish to monitor.
- Next, select the External agent that will monitor the target host serve.
- Finally, click the Add button to register the changes.
-
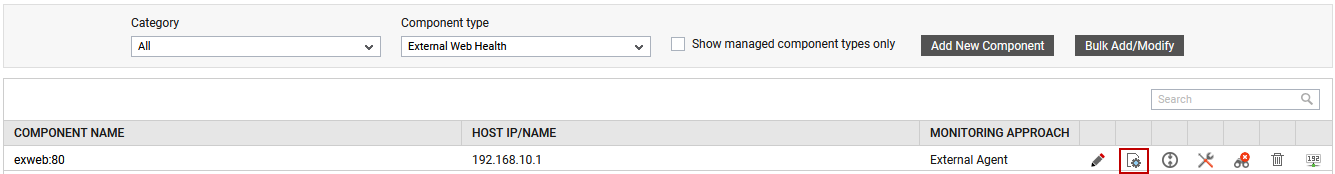
Once the target component is added successfully, you will be again redirected to the Components page (see Figure 2). Using the options provided in the Components page, you can modify, unmanage or delete the newly added component. In addition, you can also configure the tests, set thresholds and maintenance policies, and change the IP address.
-
To collect the performance metrics, you may need to manually configure the tests that are mapped to the target component. To configure the tests that need manual configuration, click on the
 icon in Figure 2. This will lead you to the Specific Test Configuration page where one or more unconfigured tests for the target component will be listed in the Unconfigured Tests list box.
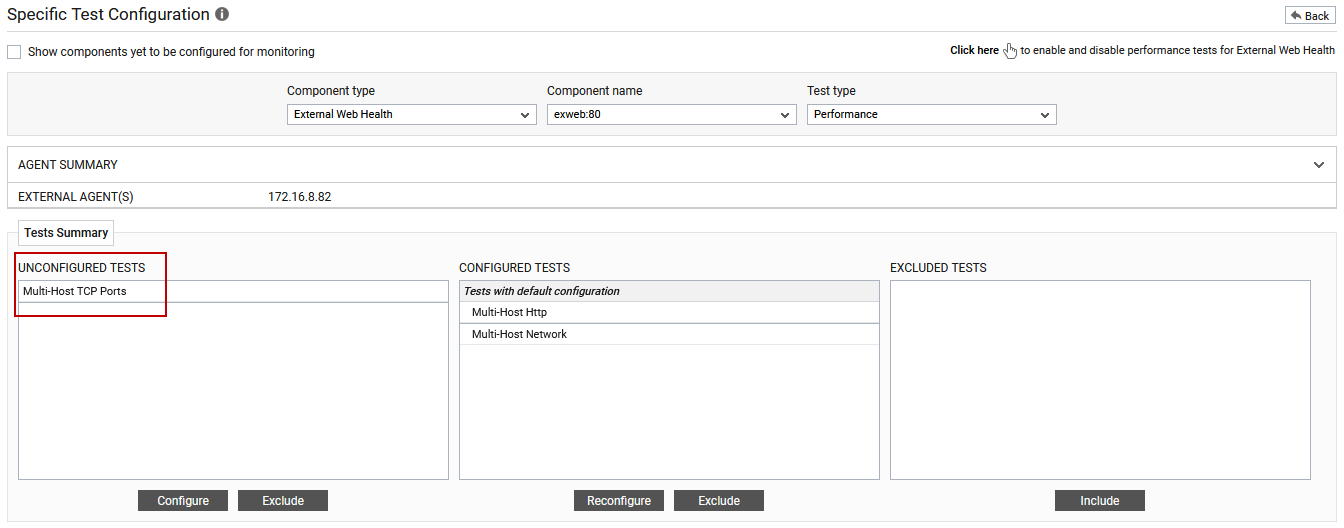
Figure 3 : Unconfigured tests for the External Web Health component
- Now, click the Multi-Host TCP Ports test to configure it. To know how to configure the tests, refer to the Monitoring Web Health Externally. To view the performance metrics, switch to the Monitor tab.