Managing the Tenant Infrastructure
To manage their infrastructure, the tenant should click the Manage Infrastructure  icon in the left panel of the Overview page of the eG admin interface.
Figure 1 will then appear.
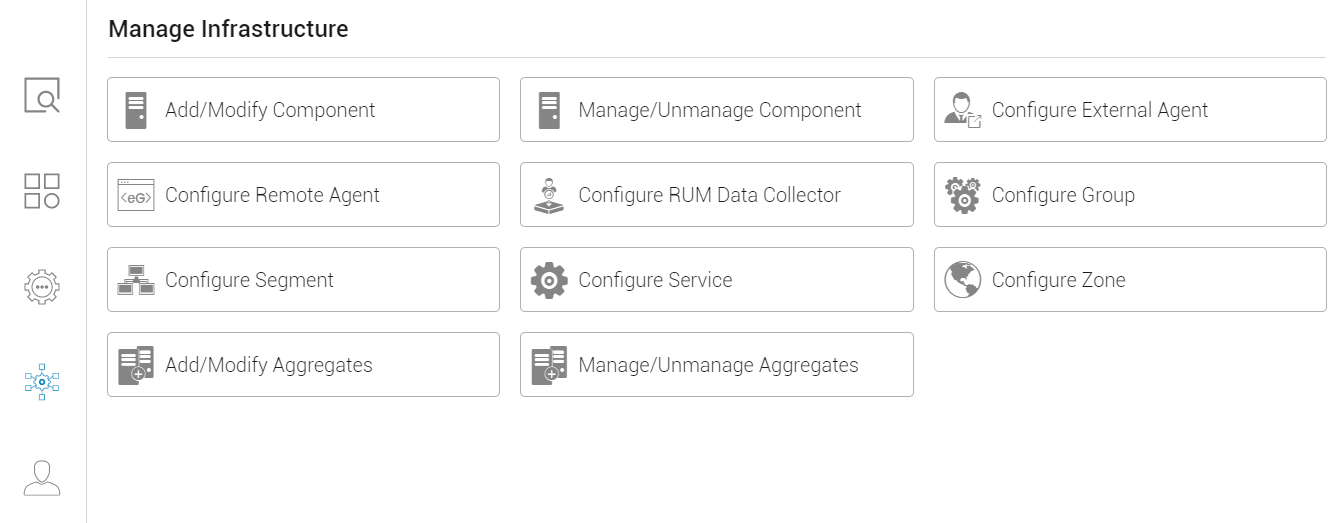
Figure 1 : Options to manage the infrastructure
The Manage Infrastructure page offers the following options to the tenant:
- Add/Modify Components: As already mentioned, the eG agents auto-discover the components in the tenant environment. Sometimes however, the eG agent may not be able to discover certain components - eg., agents cannot discover network devices in the environment. To monitor such components, the tenants may want to manually add them to the eG Enterprise system. Likewise, the tenant may want to modify the configuration of an auto-managed component - say, to change its port, to assign a different external agent to the component etc. To achieve the above, click the Add/Modify Component option in Figure 1. To know how to add/modify a component using the eG web console, refer to Adding/Modifying Components .
- Manage/Unmanage Component: The tenant can unmanage one/more auto-managed components of a type using this option. To know how to manage/unmanage components using the eG user interface, refer to the Managing/Unmanaging Components
- Configure External Agent: External agents are typically used for monitoring network devices and for reporting the availability and responsiveness of managed components over the network. By default, the eG agent on the eG manager host functions as an external agent. If required, a tenant can add more external agents to their environment and assign hosts/devices to them for monitoring. The Configure External Agent option helps tenants achieve this. To know how to configure additional external agents using the eG user interface, refer to the Administering eG Enterprise document.
- Configure Remote Agent: eG Enterprise implements agentless monitoring using Remote Agents. A tenant can use the Configure Remote Agent option to add one/more remote agents and assign remote hosts to them for monitoring. To know how to achieve this, refer to the Administering eG Enterprise document.
- Configure RUM Data Collector: If you have enabled Real User Monitoring of one/more web sites/applications in your environment, then you will need a RUM Data Collector for collecting and analyzing the beacons of data that browsers send. To know more about RUM and how it works, refer to The eG Real User Monitor document.
- Configure Group: Server groups represent a collection of similar servers. By including a server group in a service topology representation, a tenant can indicate that all the servers in the group have the same set of dependencies on other parts of the infrastructure. Click on the Configure Group option to create new groups, and modify/delete existing groups. To know how to configure groups, refer to the Administering eG Enterprise document.
- Configure Segment: A segment is a logical entity that represents a collection of components and the interdependencies between them. Segments can be chosen to represent user groups, organizational domains, or physical locations in the tenant environment. For example, the topology of a banking environment may include two segments - one representing all the components in the bank’s NY branch and another representing the bank’s CA branch. Click on Configure Segment to create/modify segments of inter-related components. To know how to configure segments, refer to the Administering eG Enterprise document.
- Configure Service: A service can comprise just one or more independent components offering an end-user service (e.g., a web service offered by a web server). Alternatively, a service can be a number of components working in conjunction. The collection of components and their interdependencies constitutes a service. Different business processes of a tenant organization could be represented as a service. Note that a single segment topology can support multiple services and a single service may involve a subset of the components in a segment. If you want to configure business services for monitoring, click on the Configure Service option. To know how to configure services, refer to the Administering eG Enterprise document.
- Configure Zone: Tenant infrastructures spanning geographies can pose quite a monitoring challenge owing to the number of components involved and their wide distribution. A tenant might therefore prefer to monitor such an infrastructure by viewing it as smaller, more manageable business units. In eG parlance, these business units are termed zones. A zone can typically comprise of individual components, segments, services, and/or other zones that require monitoring. Click on Configure Zone to create new zones or to delete/modify existing ones. For more details about zone configuration, refer to the Administering eG Enterprise document.
- Add/Modify Aggregates and Manage/Unmanage Aggregates: eG Enterprise typically monitors every component of a type, separately. However, sometimes, tenants may require aggregate metrics about their infrastructure. For instance, tenants hosting a Citrix infrastructure might want to know the total number of users who are currently logged into all the Citrix servers in a farm, so that sudden spikes in the load on the farm (as a whole) can be accurately detected. To provide such a consolidated view, eG Enterprise embeds a license-controlled MetricAggregation capability. This feature, when enabled, allows tenants to group one or more components of a particular type in their infrastructure and monitor the group as a single logical component, broadly termed as an aggregate component. To create/modify such aggregate components, click on the Add/Modify Aggregates option. To manage/unmanage aggregates, click on the Manage/Unmanage Aggregates option. For more details about aggregates, refer to the Administering eG Enterprise document.