Configuring the eG Agent to Collect JVM-related Metrics from the WebSphere Server 6.1 and 7.0
By default, no tests are mapped to the jvm layer of the WebSphere monitoring model. If need be, you can map certain key tests with this layer, and configure these tests to report critical statistics related to the WebSphere server’s JVM. These statistics typically reveal the following:
- The count of classes loaded/unloaded (Java Classes test)
- JVM thread usage (JVM Threads test)
- CPU and memory usage of the JVM (JVM Cpu Usage test and JVM Memory Usage test)
- The effectiveness of the JVM’s garbage collection activity (JVM Garbage Collections test)
- The uptime of the JVM (JVM Uptime test)
- Whether JMX is currently enabled/disabled on the target WebLogic server (JMX Connection to JVM test)
- The count and status of file descriptors (JVM File Descriptors test)
These key tests are disabled by default for the WebSphere server.
These tests, if enabled, connect to the JRE used by the WebSphere application server to pull out the above-mentioned metrics.
Prior to enabling these tests therefore, you should configure the eG agent to connect to the JRE and collect the required metrics, using either of the following methodologies:
- JMX (Java Management Extensions)
- SNMP (Simple Network Management Protocol)
Since both JMX and SNMP support are available for JRE 1.5 and above only, these tests should be enabled only if the WebSphere server being monitored runs JRE 1.5 and above.
Once the JRE version requirement is fulfilled, you must proceed to enable the JMX support for the JRE or SNMP support for the JRE, before enabling the tests.
If you choose to use JMX for pulling out the desired metrics from the JRE, then the following broad steps need to be followed:
- First, determine whether the JMX requires no authentication at all, or requires authentication (but no security)
-
If JMX does not require authentication, follow the steps below:
- Login to the target WebSphere server.
-
Edit the management.properties file that is used by the JRE of the target WebSphere server, and configure the following in it:
- The JMX remote port
- Whether JMX is SSL-enabled or not
- Whether JMX requires authentication or not
- To know how to configure these, refer to the Monitoring Java Applications document.
- Save the file.
If the JMX requires authentication (but no security), follow the steps below:
- Login to the target WebSphere server. If the server is executing on a Windows host, then, login to the host as a local/domain administrator.
- Next, copy the jmxremote.password.template file in the <JAVA_HOME>\jre\lib\management folder to any other location on the host, rename it as as jmxremote.password, and then, copy it back to the <JAVA_HOME>\jre\lib\management folder.
- Next, edit the jmxremote.password file and the jmxremote.access file to create a user with read-write access to the JMX. To know how to create such a user, refer to Monitoring Java Applications document.
- Then, proceed to make the jmxremote.password file secure by granting a single user “full access” to that file. To know how to achieve this, refer to the Monitoring Java Applications document.
-
Edit the management.properties file that is used by the JRE of the target WebSphere server, and configure the following in it:
- The JMX remote port
- Whether JMX is SSL-enabled or not
- Whether JMX requires authentication or not
- The full path to the jmxremote.access file
- The full path to the jmxremote.password file
To know how to configure these, refer to the Monitoring Java Applications document.
- Then, save the file.
- Connect to the Admin console of the target WebSphere server using the URL: http://<WebSphereServerIP>:<WebSpherePort>
- The default port number of the WebSphere server is 9062.
- Provide the credentials for logging into the admin console, if prompted.
-
Once the console opens, follow the node sequence, Server -> Server Types -> WebSphere application servers, in the tree-structure in the left pane of the console.
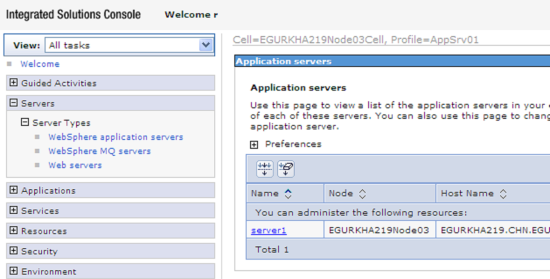
Figure 1 : Viewing the WebSphere application servers
- From the list of application servers listed in the right panel, choose the server being monitored by clicking on it.
-
Then, follow the node sequence Server Infrastructure -> Java and Process Management -> Process definition -> Java Virtual Machine, as depicted by Figure 2 and Figure 3 below:
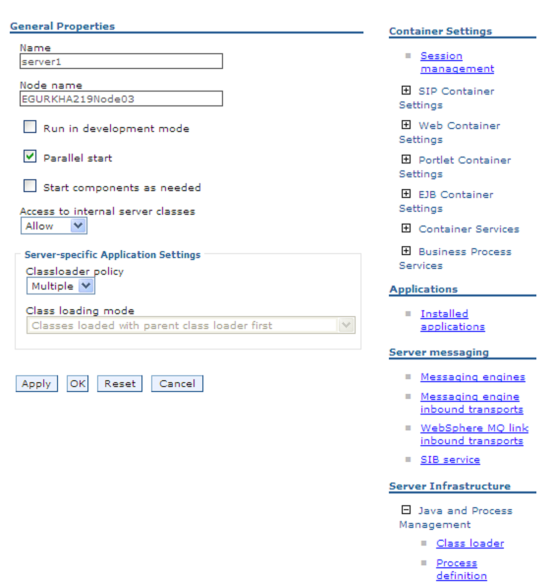
Figure 2 : Navigating to the Java Virtual Machine properties of the target WebSphere server
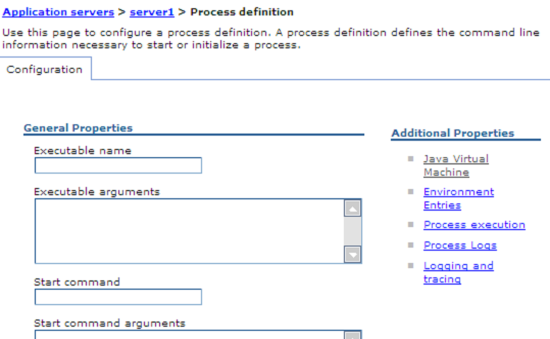
Figure 3 : Navigating to the Java Virtual Machine properties of the target WebSphere server
-
In the Generic JVM arguments text box of the Configuration section tab page that appears, add the following line:
-Djavax.management.builder.initial= -Dcom.sun.management.jmxremote
- Then, click the Apply and OK buttons.
- Finally, stop and start the target WebSphere server.