Monitoring the WebSphere Application Server 6.0 (and above)
As the WebSphere server 6.0 (and above) supports different capabilities and interfaces than the earlier versions, the eG Enterprise offers a different monitoring model for WebSphere 6.0 (and above). In the case of the WebSphere application server version 6.0 and above, the eG agent uses the JMX architecture supported by the WebSphere server to gather the required metrics.
To monitor a WebSphere Application server 6.0 (and above), a specific WebSphere monitoring eG component has to be installed on it. If the WebSphere server to be monitored uses a SOAP connector port for its internal communications, then the egurkha6.ear application (in the /opt/egurkha/lib or the <eg_install_dir>\lib directory) will have to be installed on the server. On the other hand, if the target WebSphere server uses an RMI port for communicating internally, then the egurkha6rmi.ear application should be installed on the server. The procedure for installing the 'ear' file has been discussed in detail in the Configuring a WebSphere Application Server 8.x to Work with the eG Agent.
The measures extracted by egurkha6.ear or egurkha6rmi.ear (as the case may be) are captured and displayed by the unique monitoring model that eG Enterprise prescribes for the WebSphere Application server 6.0 (and above) (see Figure 1).
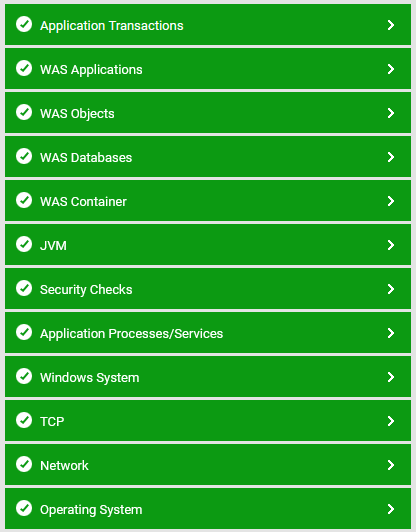
Figure 1 : Layer model of the WebSphere Application server 6.0 (or above)
The tests executing on each of the layers depicted by Figure 1 extract a wealth of performance data from the WebSphere application server, that enable WebSphere administrators to determine the following:
- Does EJB creation take too long?
- Was the WebSphere cache adequately sized, or were there too many cache misses?
- Is sufficient memory allotted to the WebSphere JVM?
- Is the thread pool adequately sized?
- Did too many connections in the database connection pool timeout?
- Are transaction rollbacks happening too frequently on the server?
- Are transactions taking too long to complete?
- How many synchronous/asynchronous requests were processed by the WebSphere gateway?
- How well does the ORB (Object Request Broker) handle requests for objects received by it?
- Were any errors detected during JSP/servlet processing?
- Are the web services executing on the WebSphere server too slow in responding to requests received by it?
The sections to come will elaborate on the tests associated with the top 5 layers only.