
Monitoring JBoss AS/EAP servers
The eG agent periodically executes tests on the JBoss AS 7 or above using the JBoss AS/EAP server, collects the necessary statistics, and reports them to the eG manager. These tests are mapped to specific layers of the JBoss AS/EAP server's layer model (see Figure 1).
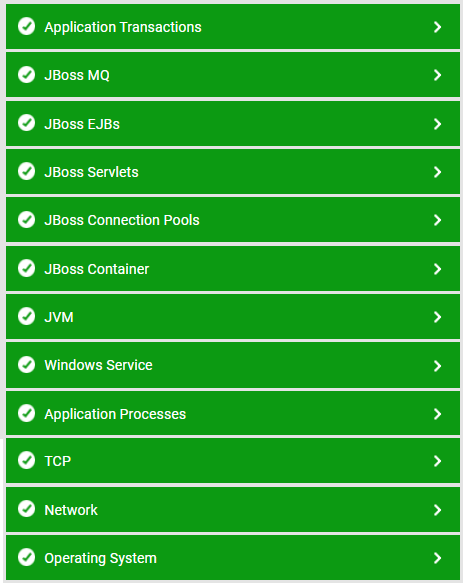
Figure 1 : The layer model of the JBoss AS/EAP server
Using the metrics reported, administrators can find quick and accurate answers for the following performance questions:
- How well each connector is processing the incoming requests?
- Are enough connections available in the connection pool of the datasources and XA-datasources, or do more connections have to be allotted to the pool?
- Are there adequate prepared statements available? How well the prepared statements are accessed from the prepared statement cache?
- How frequently was the servlet invoked?
- Does the servlet take too long to execute?
- How frequently are EJBs created/removed?
- Are there any EJBs that are ready to service clients?
- How many EJBs are currently in the EJB pool?
- Are too many messages have been enqueued?
- How quickly does the queue process messages within?
- Does the topic take too long to process messages?
- What type of messages are currently available in the topic - durable or non-durable?
- How many durable subscribers are there to a topic?
- How well each type of transaction is processed?
The Operating System, Network, TCP, Application Processes and Windows Services layers of the JBoss AS/EAP monitoring model is similar to that of a Windows Generic server model. Refer to the Monitoring Unix and Windows Servers document to know more about the tests pertaining to these layers. The JVM layer of this server is similar to that of the Java Application server monitoring model. Since the tests pertaining to these layers have been dealt with in the Monitoring Java Application servers document,
