JVM CPU Usage Test
This test measures the CPU utilization of the JVM. If the JVM experiences abnormal CPU usage levels, you can use this test to instantly drill down to the threads that are contributing to the CPU spike. Detailed stack trace information provides insights to code level information that can highlight problems with the design of the Java application.
Note:
This test will not report metrics if the Mode parameter of the test is set to SNMP.
Target of the test : A Java application
Agent deploying the test : An internal/remote agent
Outputs of the test : One set of results for the Java application being monitored
| Parameter | Description |
|
Test period |
How often should the test be executed |
|
Host |
The host for which the test is to be configured. |
|
Port |
The port number at which the specified host listens to |
|
Metric Collection Type |
This test can extract metrics from the Java application using either of the following mechanisms:
To configure the test to collect metrics from the eg_btm.jar file, select the JAR option. On the other hand, to configure the test to use SNMP or JMX options, choose the Others option. By default, JAR option is chosen here. |
|
Mode |
This flag will appear only when the Others option is chosen against the Metric Collection Type flag. To configure the test to use SNMP to extract metrics from the target Java application, select the SNMP option. On the other hand, choose the JMX option to configure the test to use JMX instead. By default, the JMX option is chosen here. |
|
JMX Remote Port |
This parameter appears only if the mode is set to JMX. Here, specify the port at which the JMX listens for requests from remote hosts. Ensure that you specify the same port that you configured in the management.properties file in the <JAVA_HOME>\jre\lib\management folder used by the target application . To know more, refer to Enabling JMX Support for JRE |
|
JNDI Name |
This parameter appears only if the mode is set to JMX. The JNDIname is a lookup name for connecting to the JMX connector. By default, this is jmxrmi. If you have resgistered the JMX connector in the RMI registery using a different lookup name, then you can change this default value to reflect the same. |
|
JMX User, JMX Password, and Confirm password |
These parameters appear only if the Mode is set to JMX. If JMX requires authentication only (but no security), then ensure that the user and password parameters are configured with the credentials of a user with read-write access to JMX. To know how to create this user, refer to Configuring the eG Agent to Support JMX Authentication. Confirm the password by retyping it in the Confirm Password text box. |
|
Provider |
This parameter appears only if the Mode is set to JMX. This test uses a JMX Provider to access the MBean attributes of the target Java application and collect metrics. Specify the package name of this JMX Provider here. By default, this is set to com.sun.jmx.remote.protocol. |
|
JMX Registry SSL |
This parameter appears only if the Mode is set to JMX. If you have registered the JMX connector in an SSL-enabled RMI registry , set this flag to Yes. By default, this is set to No. |
|
Timeout |
Specify the duration (in seconds) for which this test should wait for a response from the target Java application. If there is no response from the target beyond the configured duration, the test will timeout. By default, this is set to 240 seconds if the Mode is JMX, and 10 seconds if the Mode is SNMP. |
|
SNMPPort |
This parameter appears only if the Mode is set to SNMP. Here specify the port number through which the server exposes its SNMP MIB. Ensure that you specify the same port you configured in the management.properties file in the <JAVA_HOME>\jre\lib\management folder used by the target application. To know more, refer to Enabling SNMP Support for JRE |
|
SNMP Version |
This parameter appears only if the Mode is set to SNMP. The default selection in the SNMP version list is v1. However, for this test to work, you have to select SNMP v2 or v3 from this list, depending upon which version of SNMP is in use in the target environment. |
|
SNMP Community |
This parameter appears only if the Mode is set to SNMP. Here, specify the SNMP community name that the test uses to communicate with the mail server. The default is public. This parameter is specific to SNMP v1 and v2 only. Therefore, if the SNMP version chosen is v3, then this parameter will not appear. |
|
User Name |
This parameter appears only when v3 is selected as the SNMP version. SNMP version 3 (SNMPv3) is an extensible SNMP Framework which supplements the SNMPv2 Framework, by additionally supporting message security, access control, and remote SNMP configuration capabilities. To extract performance statistics from the MIB using the highly secure SNMP v3 protocol, the eG agent has to be configured with the required access privileges – in other words, the eG agent should connect to the MIB using the credentials of a user with access permissions to be MIB. Therefore, specify the name of such a user against this parameter. |
|
Context |
This parameter appears only when v3 is selected as the SNMPVERSION. An SNMP context is a collection of management information accessible by an SNMP entity. An item of management information may exist in more than one context and an SNMP entity potentially has access to many contexts. A context is identified by the SNMPEngineID value of the entity hosting the management information (also called a contextEngineID) and a context name that identifies the specific context (also called a contextName). If the USERNAME provided is associated with a context name, then the eG agent will be able to poll the MIB and collect metrics only if it is configured with the context name as well. In such cases therefore, specify the context name of the username in the context text box. By default, this parameter is set to none. |
|
AuthPass |
Specify the password that corresponds to the above-mentioned user name. This parameter once again appears only if the snmpversion selected is v3. |
|
Confirm Password |
Confirm the AuthPass by retyping it here |
|
Auth Type |
This parameter too appears only if v3 is selected as the SNMPversion. From the AuthType list box, choose the authentication algorithm using which SNMP v3 converts the specified username and password into a 32-bit format to ensure security of SNMP transactions. You can choose between the following options:
|
|
Encryptflag |
This flag appears only when v3 is selected as the SNMPVersion. By default, the eG agent does not encrypt SNMP requests. Accordingly, the flag is set to No by default. To ensure that SNMP requests sent by the eG agent are encrypted, select the Yes option. |
|
Encrypt Password |
Specify the Encryption Password here. |
|
Confirm Password |
Confirm the Encryption Password by retyping it here. |
|
Data over TCP |
This parameter is applicable only if mode is set to SNMP. By default, in an IT environment, all data transmission occurs over UDP. Some environments however, may be specifically configured to offload a fraction of the data traffic – for instance, certain types of data traffic or traffic pertaining to specific components – to other protocols like TCP, so as to prevent UDP overloads. In such environments, you can instruct the eG agent to conduct the SNMP data traffic related to the monitored target over TCP (and not UDP). For this, set this flag to Yes. By default, this flag is set to No. |
|
USEPS |
This flag is applicable only for AIX LPARs. By default, on AIX LPARs, this test uses the tprof command to compute CPU usage. Accordingly, this flag is set to No by default. On some AIX LPARs however, the tprof command may not function properly (this is an AIX issue). While monitoring such AIX LPARs therefore, you can configure the test to use the ps command instead for metrics collection. To do so, set this flag to Yes. Note: Alternatively, you can set the AIXUSEPS flag in the [AGENT_SETTINGS] section of the eg_tests.ini file (in the <EG_INSTALL_SIR>\manager\config directory) to yes (default: no) to enable the eG agent to use the ps command for CPU usage computations on AIX LPARs. If this global flag and the USEPS flag for a specific component are both set to no, then the test will use the default tprof command to compute CPU usage for AIX LPARs. If either of these flags is set to yes, then the ps command will perform the CPU usage computations for monitored AIX LPARs. In some high-security environments, the tprof command may require some special privileges to execute on an AIX LPAR (eg., sudo may need to be used to run tprof). In such cases, you can prefix the tprof command with another command (like sudo) or the full path to a script that grants the required privileges to tprof. To achieve this, edit the eg_tests.ini file (in the <EG_INSTALL_DIR>\manager\config directory), and provide the prefix of your choice against the AixTprofPrefix parameter in the [AGENT_SETTINGS] section. Finally, save the file. For instance, if you set the AixTprofPrefix parameter to sudo, then the eG agent will call the tprof command as sudo tprof. |
|
Detailed Diagnosis |
To make diagnosis more efficient and accurate, the eG Enterprise embeds an optional detailed diagnostic capability. With this capability, the eG agents can be configured to run detailed, more elaborate tests as and when specific problems are detected. To enable the detailed diagnosis capability of this test for a particular server, choose the On option. To disable the capability, click on the Off option. The option to selectively enable/disable the detailed diagnosis capability will be available only if the following conditions are fulfilled:
|
|
Engine ID |
This parameter appears only when v3 is selected as the SNMPVersion. Sometimes, the test may not report metrics when AES192 or AES256 is chosen as the Encryption type. To ensure that the test report metrics consistently, administrators need to set this flag to Yes. By default, this parameter is set to No. |
| Measurement | Description | Measurement Unit | Interpretation |
|---|---|---|---|
|
CPU utilization of JVM |
Indicates the percentage of total available CPU time taken up by the JVM. |
Percent |
If a system has multiple processors, this value is the total CPU time used by the JVM divided by the number of processors on the system. Ideally, this value should be low. An unusually high value or a consistent increase in this value is indicative of abnormal CPU usage, and could warrant further investigation. In such a situation, you can use the detailed diagnosis of this measure, if enabled, to determine which runnable threads are currently utilizing excessive CPU. |
The detailed diagnosis of the CPU utilization of JVM measure lists all the CPU-consuming threads currently executing in the JVM, in the descending order of the Percentage CPU Time of the threads; this way, you can quickly and accurately identify CPU-intensive threads in the JVM. In addition to CPU usage information, the detailed diagnosis also reveals the following information for every thread:
- The number of times the thread was blocked during the last measurement period, the total duration of the blocks, and the percentage of time for which the thread was blocked;
- The number of times the thread was in waiting during the last measurement period, the total duration waited, and the percentage of time for which the thread waited;
- The Stacktrace of the thread, using which you can nail the exact line of code causing the CPU consumption of the thread to soar;
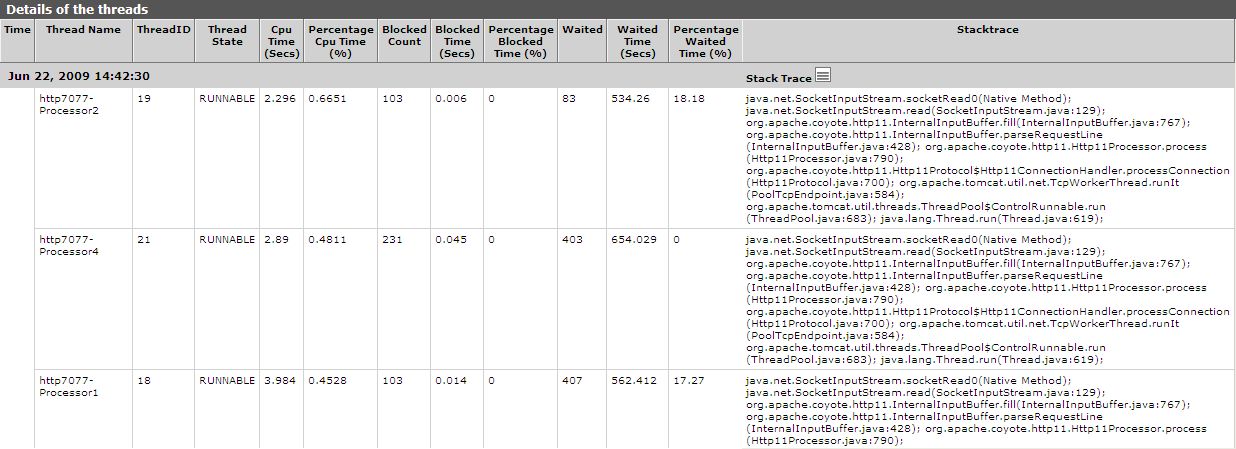
Figure 1 : The detailed diagnosis of the CPU utilization of JVM measure