JVM Memory Usage Test
This test monitors every memory type on the JVM and reports how efficiently the JVM utilizes the memory resources of each type.
Note:
-
For this test to report detailed diagnostics, the target Java application should use the JDK/JRE offered by one of the following vendors only: Oracle, Sun, OpenJDK , Azul Zing
-
If the target Java application is running using an IBM JRE/JDK, then, this test will not report detailed diagnostics. To enable the test to report DD, a MAT plugin is required. Currently, only an eG agent on an AIX system (using an IBM JDF/JRE) can be configured to use this plugin. This plugin needs to be downloaded and extracted into the target AIX host. Once this is done, then the next time the eG agent runs this test, it takes the help of the plugin to read the usage statistics of object types from the heap dump file, and finally reports these metrics to the eG manager. To know how to install and configure the MAT plugin, refer to the Installing and Configuring the MAT Plugin

Heap dump analysis using the MAT plugin is resource-intensive. It is not recommended for usage in production servers.
- This test can provide detailed diagnosis information for only those monitored Java applications that use JRE 1.6 or higher.
- This test can run in an agent-based/agentless manner only, but detailed diagnostics will be available only if the test is run in an agent-based manner.
-
For an Azul Zing JVM, you can have this test report additional metrics on heap memory usage by enabling the MemoryMXBean interface. MemoryMXBean is an interface used by the Zing management system to access memory-related properties. The MemoryMXBean provides an overview of the memory system and the memory managers that control the size and use patterns of memory. To enable the MemoryMXBean interface, add the following JVM option in the start-up script of the target application.
-XX:+UseZingMXBeans
Also, to enable the test to report detailed diagnostics for a Zing JVM, make sure that the following JVM option is included in the start-up script of the target application:
-XX:+ProfileLiveObjects
Target of the test : A Java application
Agent deploying the test : An internal/remote agent
Outputs of the test : One set of results for every memory type on the JVM being monitored
| Parameter | Description |
|
Test period |
How often should the test be executed |
|
Host |
The host for which the test is to be configured. |
|
Port |
The port number at which the specified host listens to |
| Metric Collection Type |
This test can extract metrics from the Java application using either of the following mechanisms:
To configure the test to collect metrics from the eg_btm.jar file, select the JAR option. On the other hand, to configure the test to use JMX options, choose the JMX option. By default, JAR option is chosen here. |
|
Mode |
This flag will appear only when the Others option is chosen against the Metric Collection Type flag. To configure the test to use SNMP to extract metrics from the target Java application, select the SNMP option. On the other hand, choose the JMX option to configure the test to use JMX instead. By default, the JMX option is chosen here. |
|
JMX Remote Port |
This parameter appears only if the mode is set to JMX. Here, specify the port at which the JMX listens for requests from remote hosts. Ensure that you specify the same port that you configured in the management.properties file in the <JAVA_HOME>\jre\lib\management folder used by the target application. To know more, refer to Enabling JMX Support for JRE |
|
JNDI Name |
This parameter appears only if the mode is set to JMX. The JNDIname is a lookup name for connecting to the JMX connector. By default, this is jmxrmi. If you have resgistered the JMX connector in the RMI registery using a different lookup name, then you can change this default value to reflect the same. |
|
JMX User, JMX Password, and Confirm password |
These parameters appear only if the Mode is set to JMX. If JMX requires authentication only (but no security), then ensure that the user and password parameters are configured with the credentials of a user with read-write access to JMX. To know how to create this user, refer to Configuring the eG Agent to Support JMX Authentication. Confirm the password by retyping it in the Confirm Password text box. |
|
Provider |
This parameter appears only if the Mode is set to JMX. This test uses a JMX Provider to access the MBean attributes of the target Java application and collect metrics. Specify the package name of this JMX Provider here. By default, this is set to com.sun.jmx.remote.protocol. |
|
JMX Registry SSL |
This parameter appears only if the Metric Collection Type flag is set to JMX. If you have registered the JMX connector in an SSL-enabled RMI registry , set this flag to Yes. By default, this is set to No. |
|
Timeout |
Specify the duration (in seconds) for which this test should wait for a response from the target Java application. If there is no response from the target beyond the configured duration, the test will timeout. By default, this is set to 240 seconds if the Mode is JMX, and 10 seconds if the Mode is SNMP. |
|
SNMPPort |
This parameter appears only if the Mode is set to SNMP. Here specify the port number through which the server exposes its SNMP MIB. Ensure that you specify the same port you configured in the management.properties file in the <JAVA_HOME>\jre\lib\management folder used by the target application. To know more, refer to Enabling SNMP Support for JRE |
|
SNMP Version |
This parameter appears only if the Mode is set to SNMP. The default selection in the SNMP version list is v1. However, for this test to work, you have to select SNMP v2 or v3 from this list, depending upon which version of SNMP is in use in the target environment. |
|
SNMP Community |
This parameter appears only if the Mode is set to SNMP. Here, specify the SNMP community name that the test uses to communicate with the mail server. The default is public. This parameter is specific to SNMP v1 and v2 only. Therefore, if the SNMP version chosen is v3, then this parameter will not appear. |
|
User Name |
This parameter appears only when v3 is selected as the SNMP version. SNMP version 3 (SNMPv3) is an extensible SNMP Framework which supplements the SNMPv2 Framework, by additionally supporting message security, access control, and remote SNMP configuration capabilities. To extract performance statistics from the MIB using the highly secure SNMP v3 protocol, the eG agent has to be configured with the required access privileges – in other words, the eG agent should connect to the MIB using the credentials of a user with access permissions to be MIB. Therefore, specify the name of such a user against this parameter. |
|
Authpass |
Specify the password that corresponds to the above-mentioned user name. This parameter once again appears only if the snmpversion selected is v3. |
|
Confirm password |
Confirm the Authpass by retyping it here |
|
Authtype |
This parameter too appears only if v3 is selected as the SNMPversion. From the AuthType list box, choose the authentication algorithm using which SNMP v3 converts the specified username and password into a 32-bit format to ensure security of SNMP transactions. You can choose between the following options:
|
|
Encryptflag |
This flag appears only when v3 is selected as the SNMPVersion. By default, the eG agent does not encrypt SNMP requests. Accordingly, the flag is set to No by default. To ensure that SNMP requests sent by the eG agent are encrypted, select the Yes option. |
|
EncryptType |
If the EncryptFlag is set to Yes, then you will have to mention the encryption type by selecting an option from the EncryptType list. SNMP v3 supports the following encryption types:
|
|
Encrypt Password |
Specify the Encryption Password here. |
|
Confirm Password |
Confirm the Encryption Password by retyping it here. |
|
Data over TCP |
This parameter is applicable only if mode is set to SNMP. By default, in an IT environment, all data transmission occurs over UDP. Some environments however, may be specifically configured to offload a fraction of the data traffic – for instance, certain types of data traffic or traffic pertaining to specific components – to other protocols like TCP, so as to prevent UDP overloads. In such environments, you can instruct the eG agent to conduct the SNMP data traffic related to the monitored target over TCP (and not UDP). For this, set this flag to Yes. By default, this flag is set to No. |
|
Heap Analysis |
By default, this flag is set to off. This implies that the test will not provide detailed diagnosis information for memory usage, by default. To trigger the collection of detailed measures, set this flag to On. Note:
|
|
Exclude Packages |
The detailed diagnosis of this test, if enabled, lists the Java classes/packages that are using the pool memory and the amount of memory used by each class/package. To enable administrators to focus on the memory consumed by those classes/packages that are specific to their application, without being distracted by the memory consumption of basic Java classes/packages, the test, by default, excludes some common Java packages from the detailed diagnosis. The packages excluded by default are as follows:
This is why, the Exclude Packages parameter is by default configured with the packages mentioned above. You can, if required, append more packages or patterns of packages to this comma-separated list. This will ensure that such packages also are excluded from the detailed diagnosis of the test. Note that the exclude packages parameter is of relevance only if the Heap Analysis flag is set to 'Yes'. |
|
Include Packages |
By default, this is set to all. This indicates that, by default, the detailed diagnosis of the test (if enabled) includes all classes/packages associated with the monitored Java application, regardless of whether they are basic Java packages or those that are crucial to the functioning of the application. However, if you want the detailed diagnosis to provide the details of memory consumed by a specific set of classes/packages alone, then, provide a comma-separated list of classes/packages to be included in the detailed diagnosis in the include packages text box. Note that the include packages parameter is of relevance only if the Heap Analysis flag is set to 'Yes'. |
|
Java Home |
This parameter appears only when the Heap Analysis flag is switched On. Here, provide the full path to the install directory of JDK 1.6 or higher on the application host. For example, c:\JDK1.6.0. |
|
Engine ID |
This parameter appears only when v3 is selected as the SNMPVersion. Sometimes, the test may not report metrics when AES192 or AES256 is chosen as the Encryption type. To ensure that the test report metrics consistently, administrators need to set this flag to Yes. By default, this parameter is set to No. |
|
DD Frequency |
Refers to the frequency with which detailed diagnosis measures are to be generated for this test. The default is 1:1. This indicates that, by default, detailed measures will be generated every time this test runs, and also every time the test detects a problem. You can modify this frequency, if you so desire. Also, if you intend to disable the detailed diagnosis capability for this test, you can do so by specifying none against this parameter. |
|
Detailed Diagnosis |
To make diagnosis more efficient and accurate, the eG Enterprise embeds an optional detailed diagnostic capability. With this capability, the eG agents can be configured to run detailed, more elaborate tests as and when specific problems are detected. To enable the detailed diagnosis capability of this test for a particular server, choose the On option. To disable the capability, click on the Off option. The option to selectively enable/disable the detailed diagnosis capability will be available only if the following conditions are fulfilled:
|
| Measurement | Description | Measurement Unit | Interpretation | ||||||||||||||||
|---|---|---|---|---|---|---|---|---|---|---|---|---|---|---|---|---|---|---|---|
|
Initial memory |
Indicates the amount of memory initially allocated at startup. |
MB |
|
||||||||||||||||
|
Used memory |
Indicates the amount of memory currently used. |
MB |
It includes the memory occupied by all objects, including both reachable and unreachable objects. Ideally, the value of this measure should be low. A high value or a consistent increase in the value could indicate gradual erosion of memory resources. In such a situation, you can take the help of the detailed diagnosis of this measure (if enabled), to figure out which class is using up memory excessively. |
||||||||||||||||
|
Committed memory |
Indicates the amount of memory guaranteed to be available for use by the JVM. |
MB |
The amount of Committed memory may change over time. The Java virtual machine may release memory to the system and committed memory could be less than the amount of memory initially allocated at startup. Committed will always be greater than or equal to used memory. |
||||||||||||||||
|
Free memory |
Indicates the amount of memory currently available for use by the JVM. |
MB |
If an Azul Zing JVM is being monitored, then the value of this measure will change according to the value of the Memory pool size type measure. If the Memory pool size type measure is Fixed, then the value of this measure is the difference between the value of the Max allocated memory and Used memory measures. On the other hand, if the Memory pool size type is Elastic, then the value of this measure will be the difference between the value of the Committed memory and Used memory measures. For all other JVMs, this measure is the difference between the Max allocated memory and Used memory measures. Ideally, the value of this measure should be high. Note: Sometimes, administrators may not want to cap/limit the maximum amount of memory that a JVM can use. In such cases, they may set the maximum memory to -1. If this is done, then it implies that the JVM can use any amount of memory. In this case therefore, the Maximum allocated memory will also report the value -1, but the Free memory measure will not be reported. |
||||||||||||||||
|
Max allocated memory |
Indicates the maximum amount of memory allocated for the JVM. |
MB |
In the case of the Azul Zing JVM, this measure will be reported only for memory pools of type FIXED. |
||||||||||||||||
|
Used percentage |
Indicates the percentage of used memory. |
Percent |
In the case of the Azul Zing JVM, this measure will be reported only for memory pools of type FIXED. The formula for computing the value of this measure for a FIXED memory type is as follows: (Used memory / Committed memory )*100 For all other JVMs, the value of this measure is computed using the following formula: (Used memory / Max allocated memory)*100 Ideally, the value of this measure should be low. A very high value of this measure could indicate excessive memory consumption by the JVM, which in turn, could warrant further investigation. In such a situation, you can take the help of the detailed diagnosis of this measure (if enabled), to figure out which class is using up memory excessively. |
||||||||||||||||
|
JVM heap memory exceeds initially reserved? |
Indicates whether/not the heap memory usage has exceeded the amount of memory initially reserved for this memory type. |
|
The values that this measure can report and their corresponding numeric values are listed in the table below:
Typically, the value of this measure will be Yes for a memory pool of type ELASTIC - i.e., for those descriptors that report the value ELASTIC for the Memory pool size type measure. For FIXED memory pools on the other hand, the value of this measure will generally be No. Note: By default, the test reports the Measure Values listed in the table above to indicate whether/not memory usage has exceeded allocation. In the graph of this measure however, the same is indicated using the numeric equivalents only. |
||||||||||||||||
|
Percentage heap used after GC |
Indicates the percentage of heap memory used by the Zing JVM after garbage collection. |
Percent |
This measure is reported only for Azul Zing JVM, and only when the 'MemoryMXBean' interface is enabled. This measure is only reported for the 'Heap memory usage' descriptor. If garbage collection reclaims a large amount of memory from the Zing JVM, then the value of this measure will be low. On the other hand, if the garbage collector does not reclaim much memory, or if the Java application suddenly runs a memory-intensive process when GC is being performed, then the value of this measure will be very high. |
||||||||||||||||
|
Heap occupied by application objects |
Indicates the amount of heap memory that is used by application objects. |
MB |
This measure is reported only for Azul Zing JVM, and only when the 'MemoryMXBean' interface is enabled. This measure is only reported for the 'Heap memory usage' descriptor.
|
||||||||||||||||
|
Heap reserved for holding application objects |
Indicates the amount of heap memory that was reserved for the usage of application objects. |
MB |
This measure is reported only for Azul Zing JVM, and only when the 'MemoryMXBean' interface is enabled.
This measure is only reported for the 'Heap memory usage' descriptor. |
||||||||||||||||
|
Percentage of heap used by application objects |
Indicates what percentage of its reserved memory the application objects used. |
Percent |
This measure is reported only for Azul Zing JVM, and only when the 'MemoryMXBean' interface is enabled. This measure is only reported for the 'Heap memory usage' descriptor. The formula used for computing the value of this measure is as follows: (Heap occupied by application objects/Heap reserved for holding application objects)*100 A value close to 100% is a cause for concern as it indicates that space reserved for application objects is being eroded rapidly. If the space-drain is not controlled, it can cause application performance to deteriorate. |
||||||||||||||||
|
Memory pool size type |
Indicates this memory pool's type in terms of size |
|
This measure is reported only for Azul Zing JVM, and only when the 'MemoryMXBean' interface is enabled. The values that this measure can report and their numeric values are listed in the table below:
Each of these measure values are described below:
Note: By default, the test reports the Measure Values listed in the table above to indicate the memory pool size type. In the graph of this measure however, the same is indicated using the numeric equivalents only. |
||||||||||||||||
|
Number of heap dumps |
Indicates the number of heap dumps available for this heap memory type. |
Number |
An optimal number of heap dumps taken during the lifetime of application taken at regular intervals can help in comparative analysis of application state over time to diagnose problems that change over time. Detailed diagnosis of this measure reveal additional details about each heap dump like date. heap dump file size, file path and heap dump description. |
||||||||||||||||
|
Was heap dump taken? |
Indicates if the heap dump was taken for this heap memory type during the last measurement period. |
|
The values that this measure can report and their corresponding numeric values are listed in the table below:
Typically, the value of this measure will be Yes if heap dump was taken for heap memory. Note: By default, the test reports the Measure Values listed in the table above to indicate whether/not heap dump was taken. In the graph of this measure however, the same is indicated using the numeric equivalents only. |
The detailed diagnosis of the Used memory measure, if enabled, lists all the classes that are using the pool memory, the amount and percentage of memory used by each class, the number of instances of each class that is currently operational, and also the percentage of currently running instances of each class. Since this list is by default sorted in the descending order of the percentage memory usage, the first class in the list will obviously be the leading memory consumer.
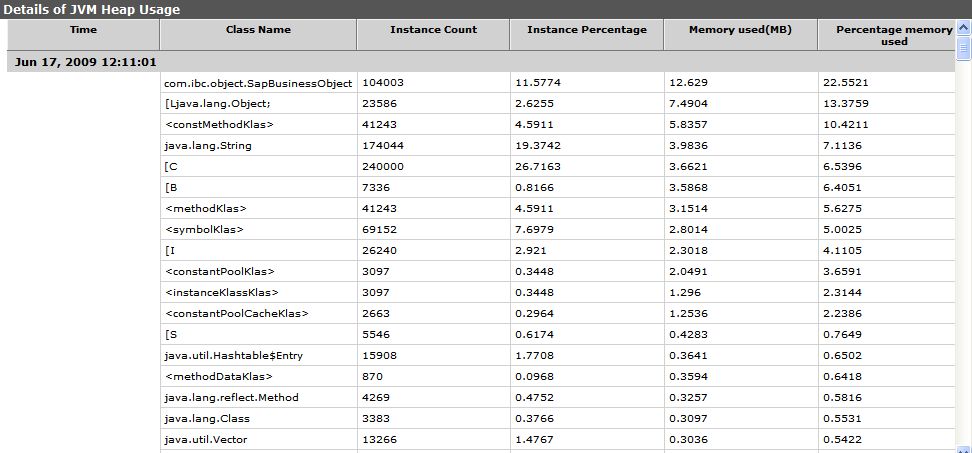
Figure 1 : The detailed diagnosis of the Used memory measure
The detailed diagnosis of Number of heap dumps measure reveal additional details about each heap dump like date. heap dump file size, file path and heap dump description.