Monitoring Microsoft SQL Servers

The pre-built Microsoft SQL monitoring model that eG Enterprise offers (see Figure 1), provides in-depth monitoring for SQL database servers.

layermodel

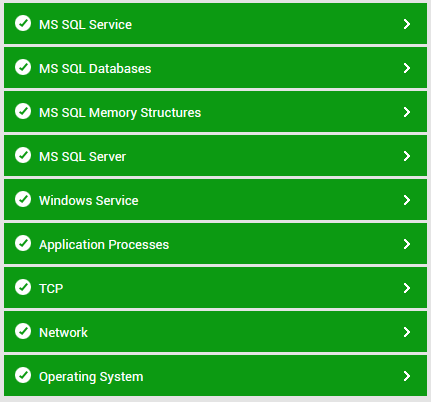
Figure 1 : Layer model for Microsoft SQL servers

Each of the layers of this hierarchical model reports a wide variety of metrics ranging from the basic operating system-level statistics to individual database related measurements to those indicating the database engine health. The table below sheds light on what the eG SQL Monitor reveals:

Database Service Monitoring

  • Is the database server available for servicing requests?
  • What is the response time for a typical query?
  • How many logins/logouts are happening on the SQL server?
  • Which applications/users are accessing the SQL server and what is their respective resource usage?
  • What queries are each of the applications currently executing?

Database Server Engine Monitoring

  • What is the CPU utilization of the database server engine?
  • How much time is the SQL server spending on processing vs. I/O?
  • What is the typical workload on the database server?
  • Which databases are imposing most load on the database server engine?
  • How many processes are running, and what queries are they executing?
  • Which user(s) are executing these queries?

Lock Activity Monitoring

  • What is the typical locking activity on the database?
  • Which processes are being blocked and by whom?
  • Which are the root-blocker processes, and what queries are they executing?
  • Are any deadlocks happening?

Database Activity and Space Monitoring

  • What databases are hosted on the SQL server?
  • Is any of the databases reaching capacity?
  • Which of the databases is seeing more transaction activity?
  • How many active transactions are currently happening to each of the database server?

SQL Memory Monitoring

  • Is there sufficient memory available for the SQL server?
  • How much memory is the server consuming and how much is it willing to consume?
  • How much memory is used for connections, how much for locks, and how much for query optimizations?
  • What is the server’s cache hit ratio?
  • How many pages are available in the server’s buffer pool?
  • How many of these are free pages?

Operating System Monitoring

  • Is there sufficient disk capacity?
  • Is there excessive contention for CPU or memory resources?
  • Are the disks unusually busy?
  • Which processes are taking up most resources (CPU, memory, disk, etc.)?

The Operating System, Network, Tcp, Application Processes, and Windows Service layers of the layer model in Figure 1 have been discussed in the Monitoring Unix and Windows Servers document. This document explains in detail the Windows Service layer is the MS SQL Server layer.