SQL Cache Test

This internal test monitors the usage of buffer memory of an MS SQL server.

Target of the test : A Microsoft SQL server

Agent deploying the test : An internal agent

Outputs of the test : One set of results for every Microsoft SQL server monitored

Configurable parameters for the test
  1. TEST PERIOD - How often should the test be executed
  2. Host – The IP address of the Microsoft SQL server.
  3. Port - The port number through which the Microsoft SQL server communicates. The default port is 1433.
  4. instance – The name of a specific Microsoft SQL instance to be monitored. The default value of this parameter is “default”. To monitor a Microsoft SQL instance named “CFS”, enter this as the value of the “instance” parameter.
  5. ISPASSIVE – If the value chosen is yes, then the Microsoft SQL server under consideration is a passive server in a SQL cluster. No alerts will be generated if the server is not running. Measures will be reported as “Not applicable" by the agent if the server is not up.
  6. useperfmon – By default, this flag is set to Yes, indicating that this test uses the Windows Perfmon utility by default to pull out the metrics of interest. To instruct the test to use queries for metrics collection and not Perfmon, set this flag to No. Typically, when monitoring a Microsoft SQL server in an agent-based manner, its best to go with the default setting – i.e., use Perfmon for metrics collection. However, when monitoring the Microsoft SQL server in an agentless manner, its ideal to use queries instead of Perfmon to collect the required metrics. In such cases, set this flag to No.
  7. DETAILED DIAGNOSIS – To make diagnosis more efficient and accurate, the eG Enterprise embeds an optional detailed diagnostic capability. With this capability, the eG agents can be configured to run detailed, more elaborate tests as and when specific problems are detected. To enable the detailed diagnosis capability of this test for a particular server, choose the On option. To disable the capability, click on the Off option.

    The option to selectively enable/disable the detailed diagnosis capability will be available only if the following conditions are fulfilled:

    • The eG manager license should allow the detailed diagnosis capability
    • Both the normal and abnormal frequencies configured for the detailed diagnosis measures should not be 0.
Measurements made by the test
Measurement Description Measurement Unit Interpretation

Cache hit ratio:

This value indicates the percentage of pages found in the cache without having to read from disk.

Percent

The ratio is the total number of cache hits divided by the total number of cache lookups since SQL Server was started. Because reading from the cache is less expensive than reading from disk, you want the ratio to be high. The higher this value is, the better. Generally, you can increase the cache hit ratio by increasing the amount of memory available to the SQL Server.  

Objects in cache:

This value indicates the number of objects found in the cache currently.

Number

The higher the count, the better the performance of the server, as it does not need to read the requested object from disk.

Log cache hit ratio:

This value indicates the percentage of log cache reads satisfied from the log cache. 

Percent

A good cache hit ratio indicates that the log cache is performing well and a low value indicates that the server needs to be tuned.

The detailed diagnosis of the Cache hit ratio measure, if enabled, provides the cache hit ratio for each cache type (see Figure 1). A high cache hit ratio is an indicator of the SQL server’s good health. The information provided by Figure 1 will therefore reveal the cache types that were effective and those that were not.

CachehitratioDD-final

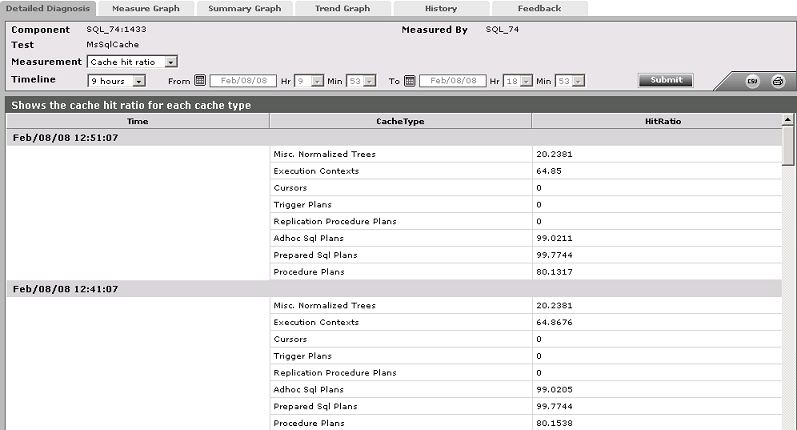
Figure 1 : The detailed diagnosis of the Cache hit ratio measure

The detailed diagnosis of the Objects in cache measure , if enabled, provides the number of objects available in each cache type (see Figure 2). This again is an indicator of the effectiveness of the cache types.

obectsincacheDD-final

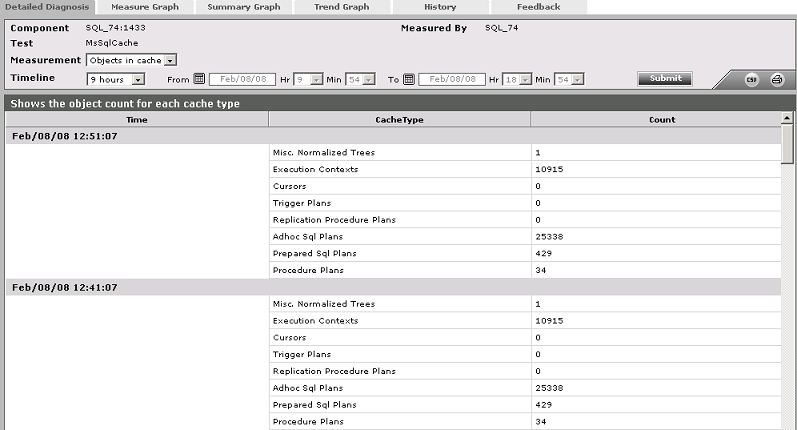
Figure 2 : The detailed diagnosis of the Objects in cache measure